Table of Contents
1. Introduction
This document is part of the “Visual Shop Floor – Solution Blueprints” series. It describes practical use cases, serves as a template for similar projects, and simultaneously illustrates the functionality of Visual Shop Floor in an industrial environment. The blueprint is therefore aimed equally at users, administrators, and decision-makers in the production domain.
This blueprint focuses on the use case “Digital SQCDP Board,” which was successfully implemented as part of a customer project. The core topics of Safety, Quality, Cost, Delivery, and Productivity are represented through specific KPIs, events, and tasks, and are complemented by Visual Shop Floor’s dynamic event handling. This creates a continuous, transparent information base for operational control, daily shop floor meetings, and the continuous improvement process.
2. Background and initial situation
Updating the metrics for Safety, Quality, Cost, Delivery, and Productivity was time-consuming and characterized by frequent media breaks, which resulted in data that was sometimes outdated, incomplete, or inconsistent. Capturing and tracking deviations proved particularly challenging: although deviations were documented, they were often unstructured, delayed, or in some cases not recorded at all. Responsibilities were rarely clearly defined, so follow-up actions were often not consistently tracked.
The shop floor meetings themselves also suffered from the analog workflow. Without a consolidated information base, team leaders relied on verbal reports, resulting in the need for extensive coordination, potential misunderstandings, and delays. Deviations were discussed, but only rarely translated systematically into actions or tracked sustainably.
Furthermore, a structured escalation process was missing, which would have enabled the timely involvement of management when needed. The result was a predominantly reactive rather than proactive approach to problem-solving.
Against this backdrop, there was a need for a digital solution that centrally captures key metrics, presents them visually, systematically maps events, and directly links them to tasks. The main challenges can be summarized as follows:
- Manual and decentralized data collection without a central data foundation
- Media disruptions and lack of transparency
- Insufficient tracking of measures
- Lack of standardized meeting procedures
- No structured escalation logic
3. Requirements and objectives
Beyond that, an SQCDP board strengthens transparency and communication within the team. It creates a shared view of processes, goals, and priorities. Decisions become traceable, responsibilities are clarified, and employees’ identification with company objectives is reinforced. In this way, the SQCDP board supports the development of a lived culture of continuous improvement.
A key prerequisite for the successful use of a digital board is a unified, reliable, and up-to-date data foundation from which KPIs can be derived consistently and in real time. This eliminates manual data preparation, avoids media disruptions, and significantly improves information quality.
In addition to visualizing current KPIs, capturing and mapping events is an essential component of an SQCDP board. Events such as workplace accidents (Safety), customer complaints (Quality), or schedule delays (Delivery) can be recorded systematically, assessed, and linked to targeted actions. This creates a central source of information that can be used both for operational decision-making and for further analysis.
In summary, the SQCDP board pursues four key objectives:
-
Transparency through real-time KPIs and structured event handling
The board makes performance, trends, and deviations immediately visible. KPIs and event data together form the foundation for fact-based decision-making.
-
Systematic task management
Tasks are captured, tracked, and completed in a structured manner. Responsibilities, due dates, and progress are visible at all times.
-
Efficient communication
All stakeholders access the same consolidated information base. Meetings become shorter, more focused, and more results-oriented.
-
Continuous improvement
Historical data, event analyses, and KPI trends enable the identification of causes, patterns, and opportunities for sustainable process optimization.
4. Solution approach for the implementation with Visual Shop Floor
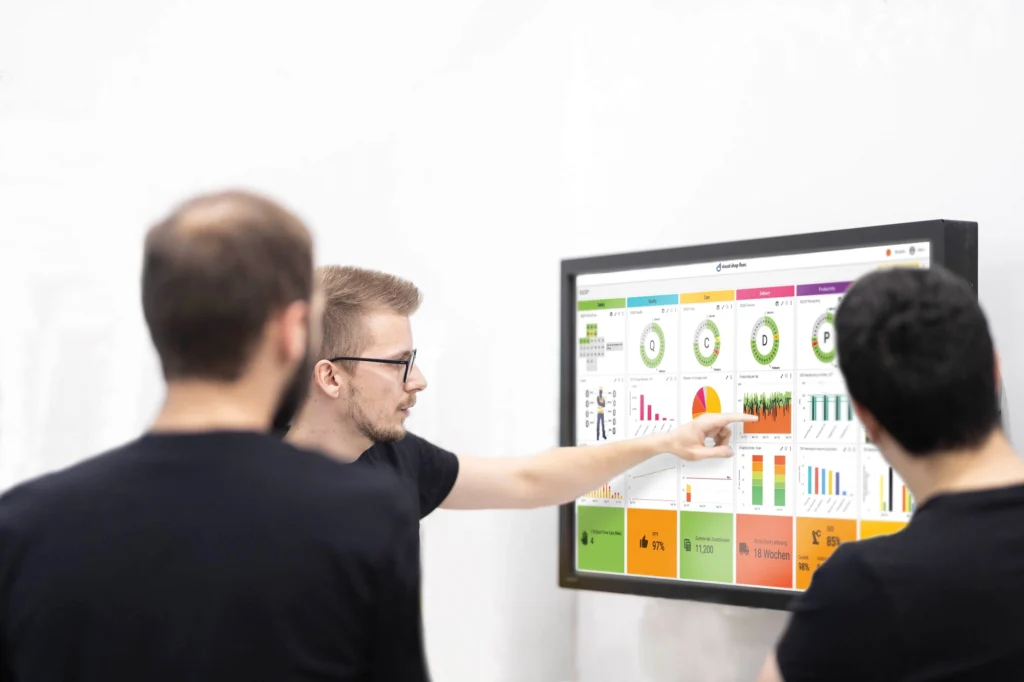
For the implementation of the digital SQCDP board, the existing modules of Visual Shop Floor were purposefully configured to optimally support the previously defined requirements for transparency, real-time capabilities, and continuous improvement. At the core was an intuitive user interface specifically designed for large-format touchscreens on the shop floor. Particular emphasis was placed on clear KPI visualization, structured event capture, and seamless integration of existing data sources.
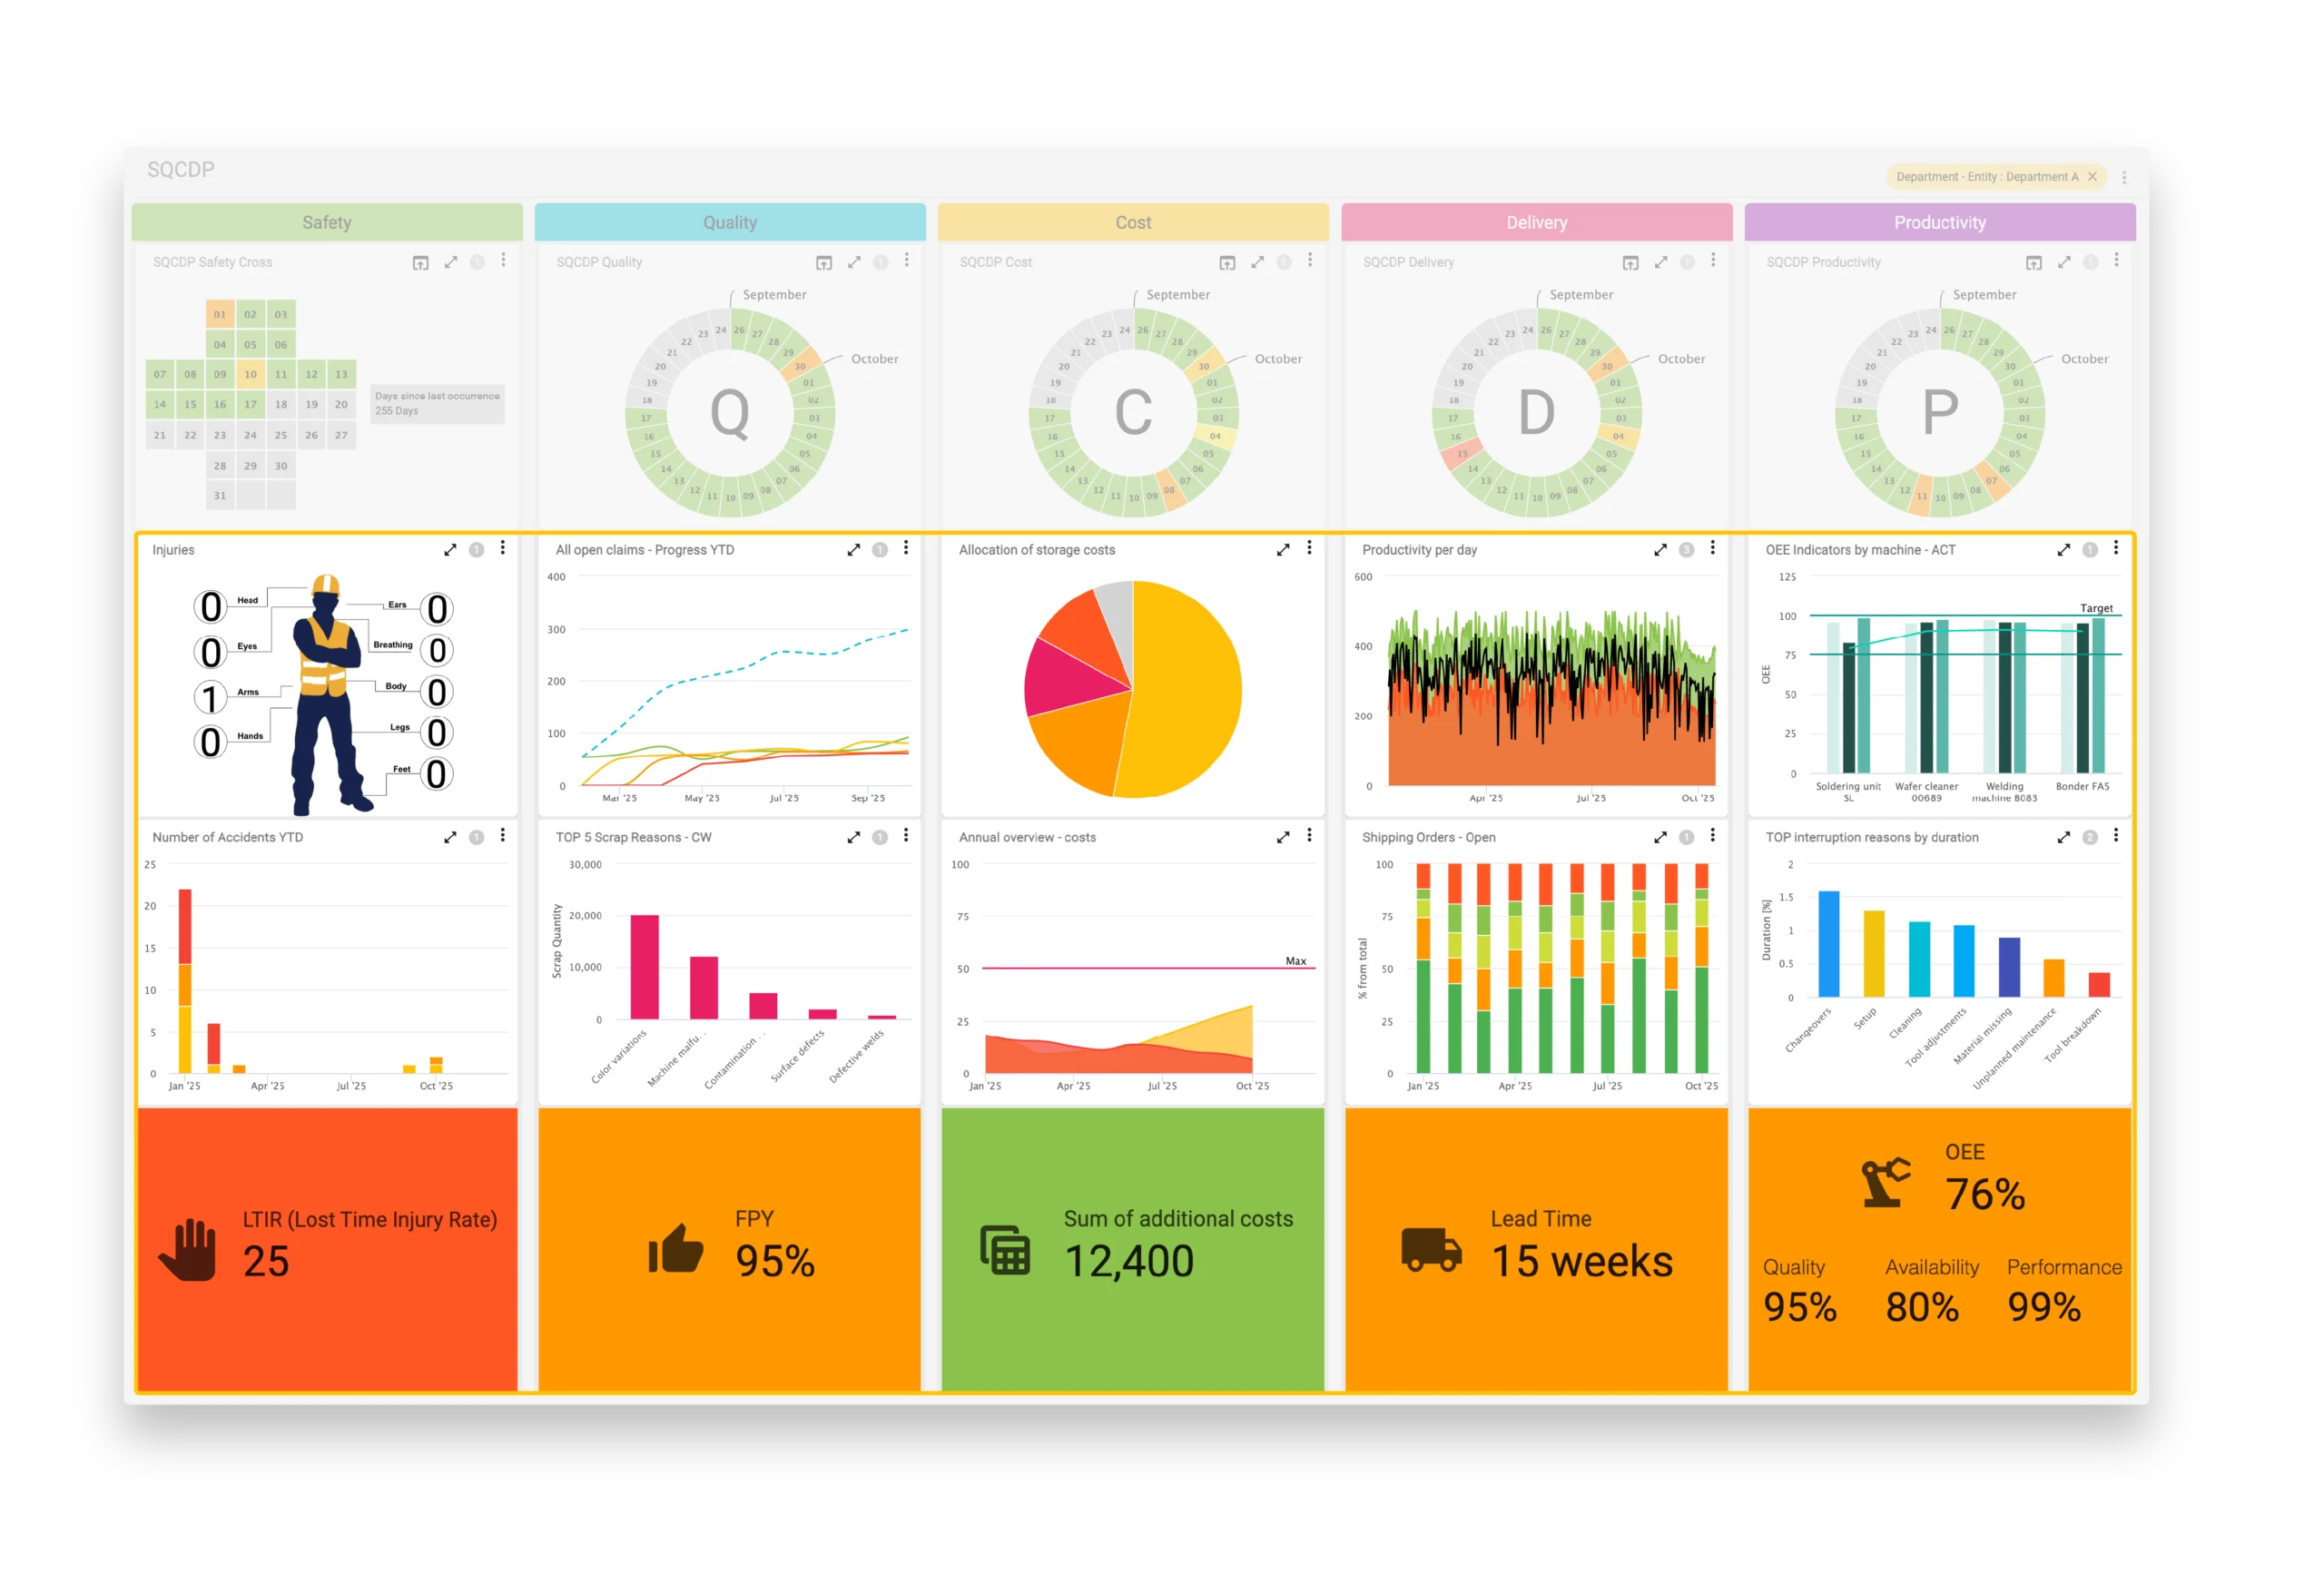
The central user interface is an interactive dashboard that visually represents the five core areas of Safety, Quality, Cost, Delivery, and Productivity. It combines KPI visualizations with event and task management. Drill-down functions provide access to detailed information and additional context. This creates a dynamic control system that combines operational transparency with data-driven decision-making.
The following components were used for the implementation:
- Data collection and system integration: Connecting relevant data sources (ERP, MES, CAQ, EHS, and machine data) via appropriate interfaces
- Data preprocessing: Cleaning, harmonizing, and contextualizing the data
- Dashboard structure: Column-based layout for the SQCDP focus areas
- Event Handling: Capturing, categorizing, and prioritizing events
- Data visualization and KPI widgets: Real-time KPIs with drill-down functionality
- Parameters: Standardized SQCDP board with specific content
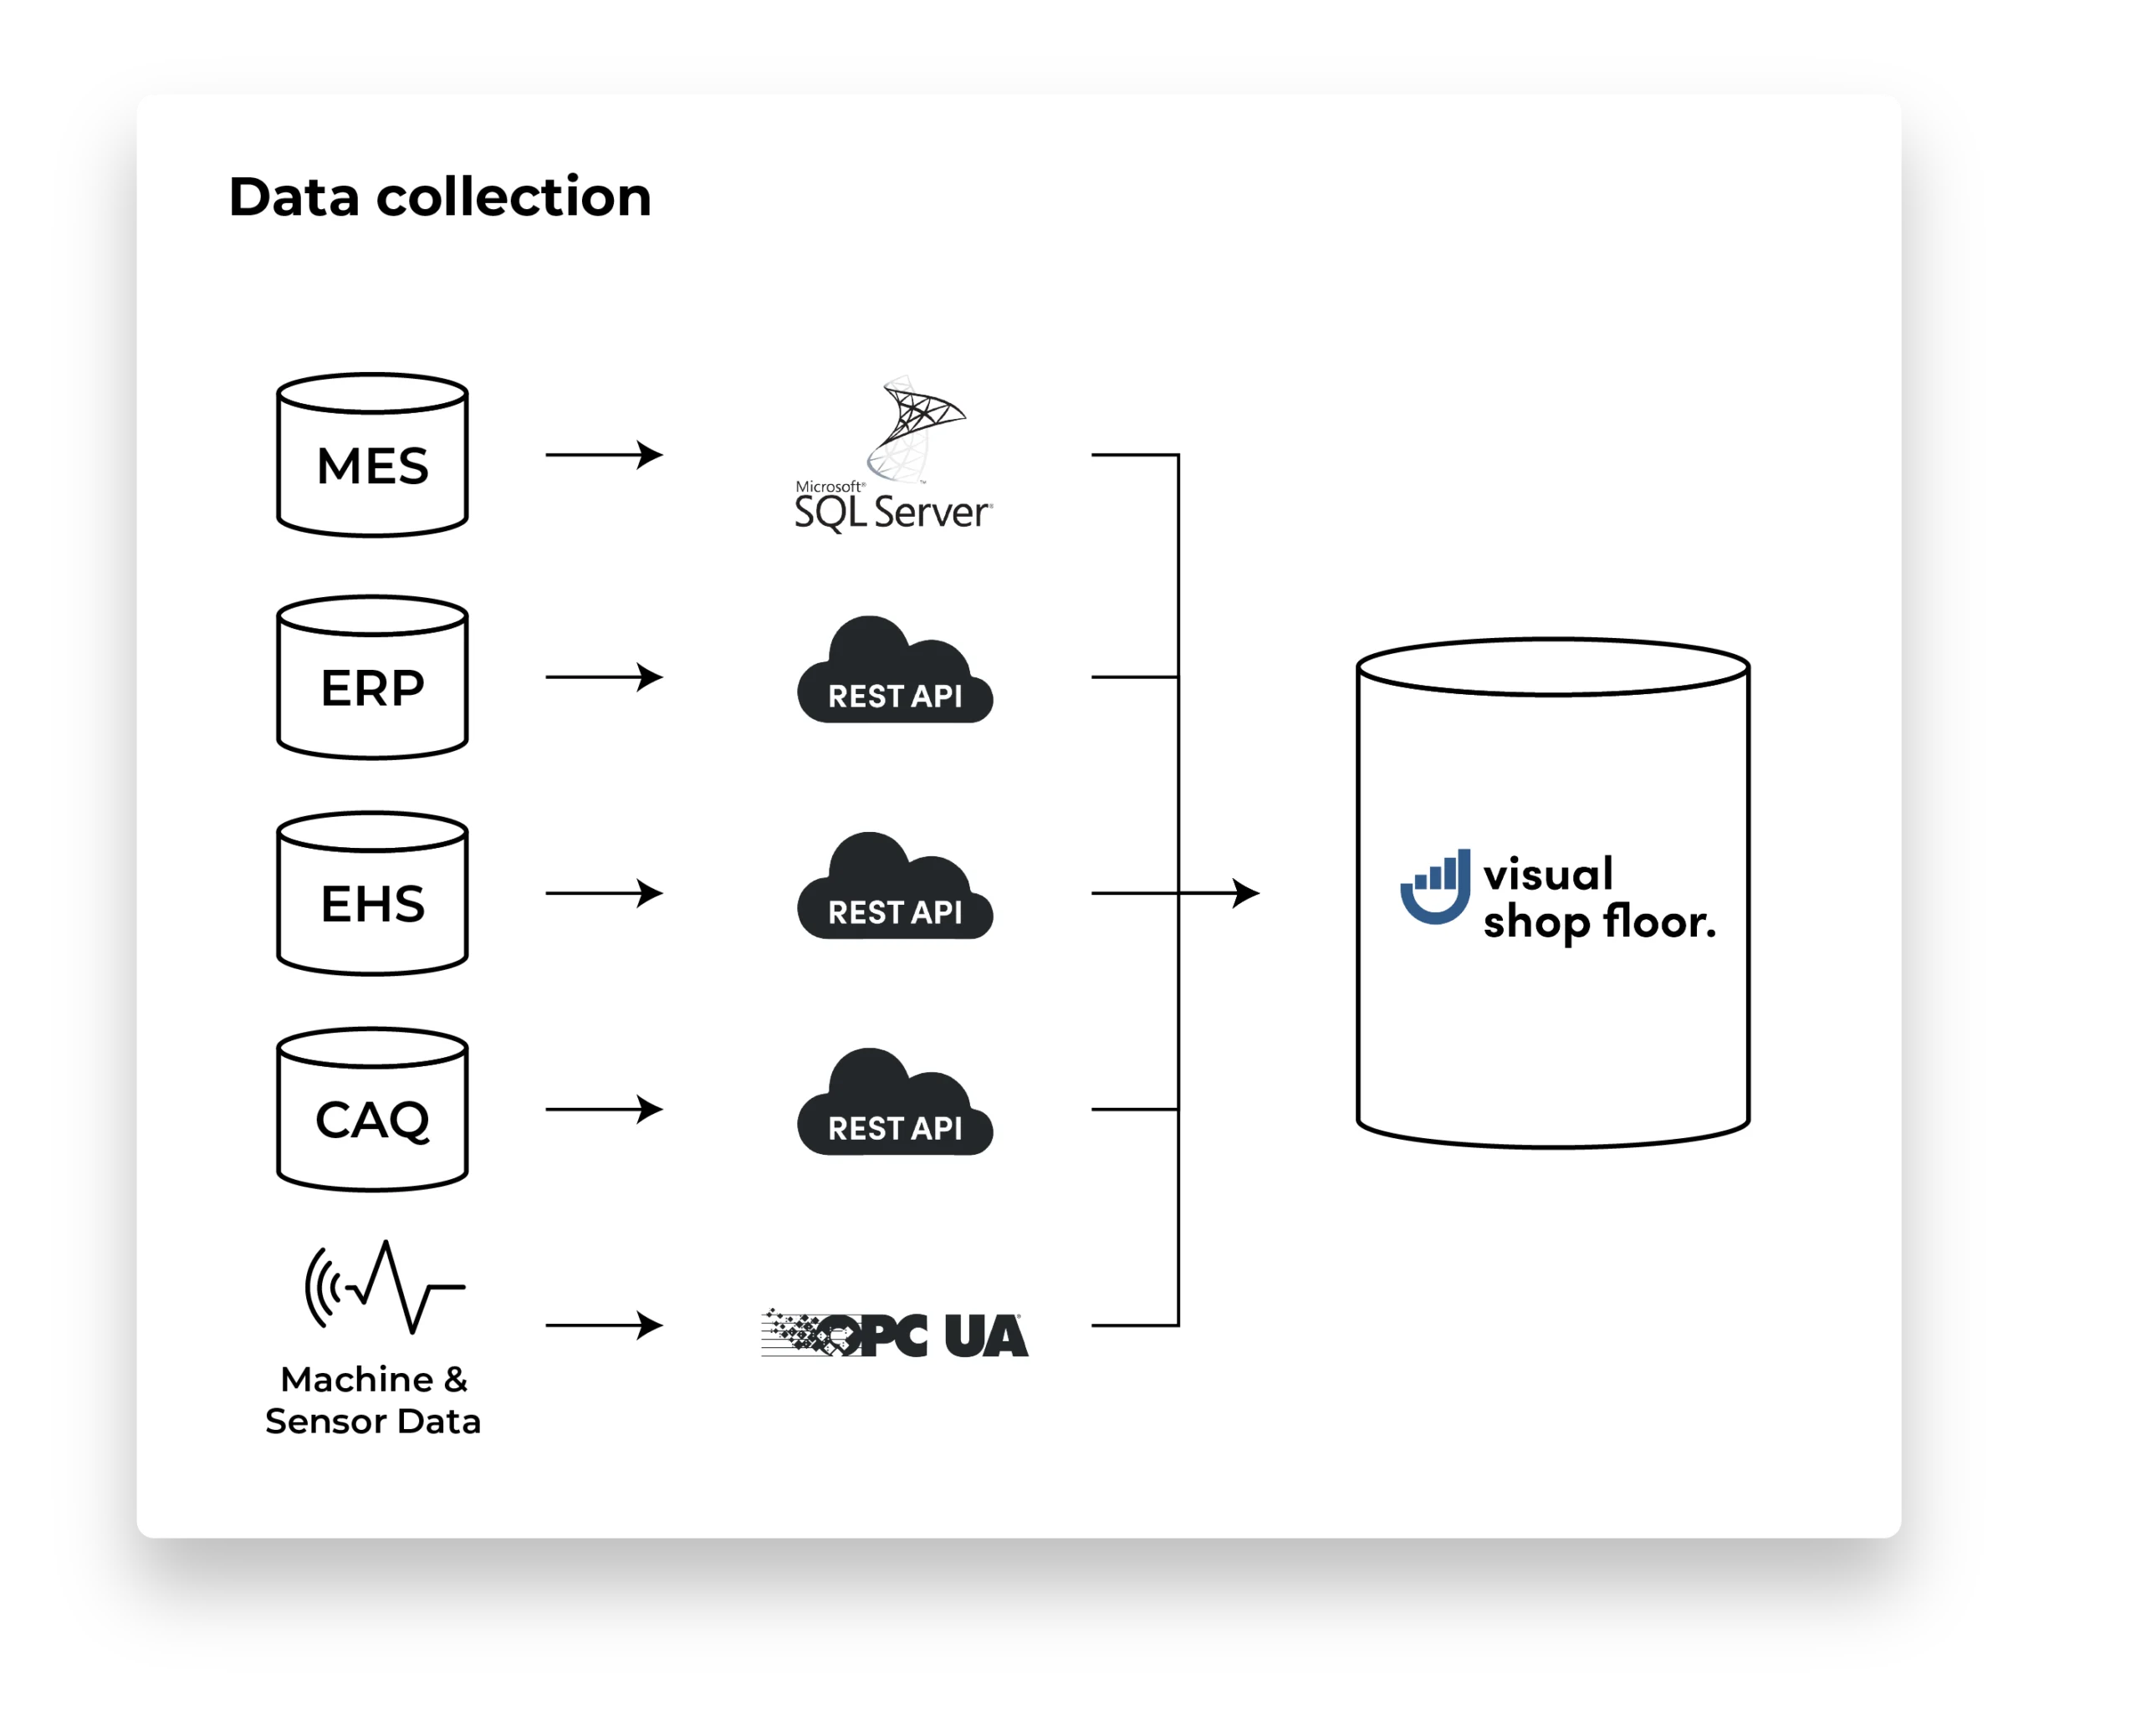
4.1 Data Collection and System Integration
In this specific project, the goal was to establish a consistent and objective data basis on which the five focus areas Safety, Quality, Cost, Delivery, and Productivity could be reliably represented. Existing information from operational systems was automatically imported, such as data on production orders, quality inspections, downtime, or training. The existing systems remained unchanged, so no adjustments to operational processes were required. Instead, the data was captured automatically, consolidated, and made available in Visual Shop Floor for operational monitoring.
In the project, the following systems were integrated:
-
ERP system
Data on orders, material consumption, cost centers, and delivery dates were automatically imported via a REST interface. These form the basis for the focus areas of Cost, Delivery, and Productivity.
-
MES
Real-time data on production progress, equipment availability, scrap, and OEE were captured through an API integration. These data were primarily used for the areas of Quality, Delivery, and Productivity.
-
EHS system
The EHS system was connected via a REST API. Accidents, near-misses, and safety inspections are automatically recorded and made available centrally.
-
CAQ system
Test results, complaints, and audit findings are transmitted via defined API endpoints, enabling central documentation of internal and external quality deviations.
-
Machine and sensor data (OPC UA)
Machine and sensor data such as equipment downtime, cycle times, and energy consumption are captured directly via OPC UA and linked with contextual information (line, shift, order).
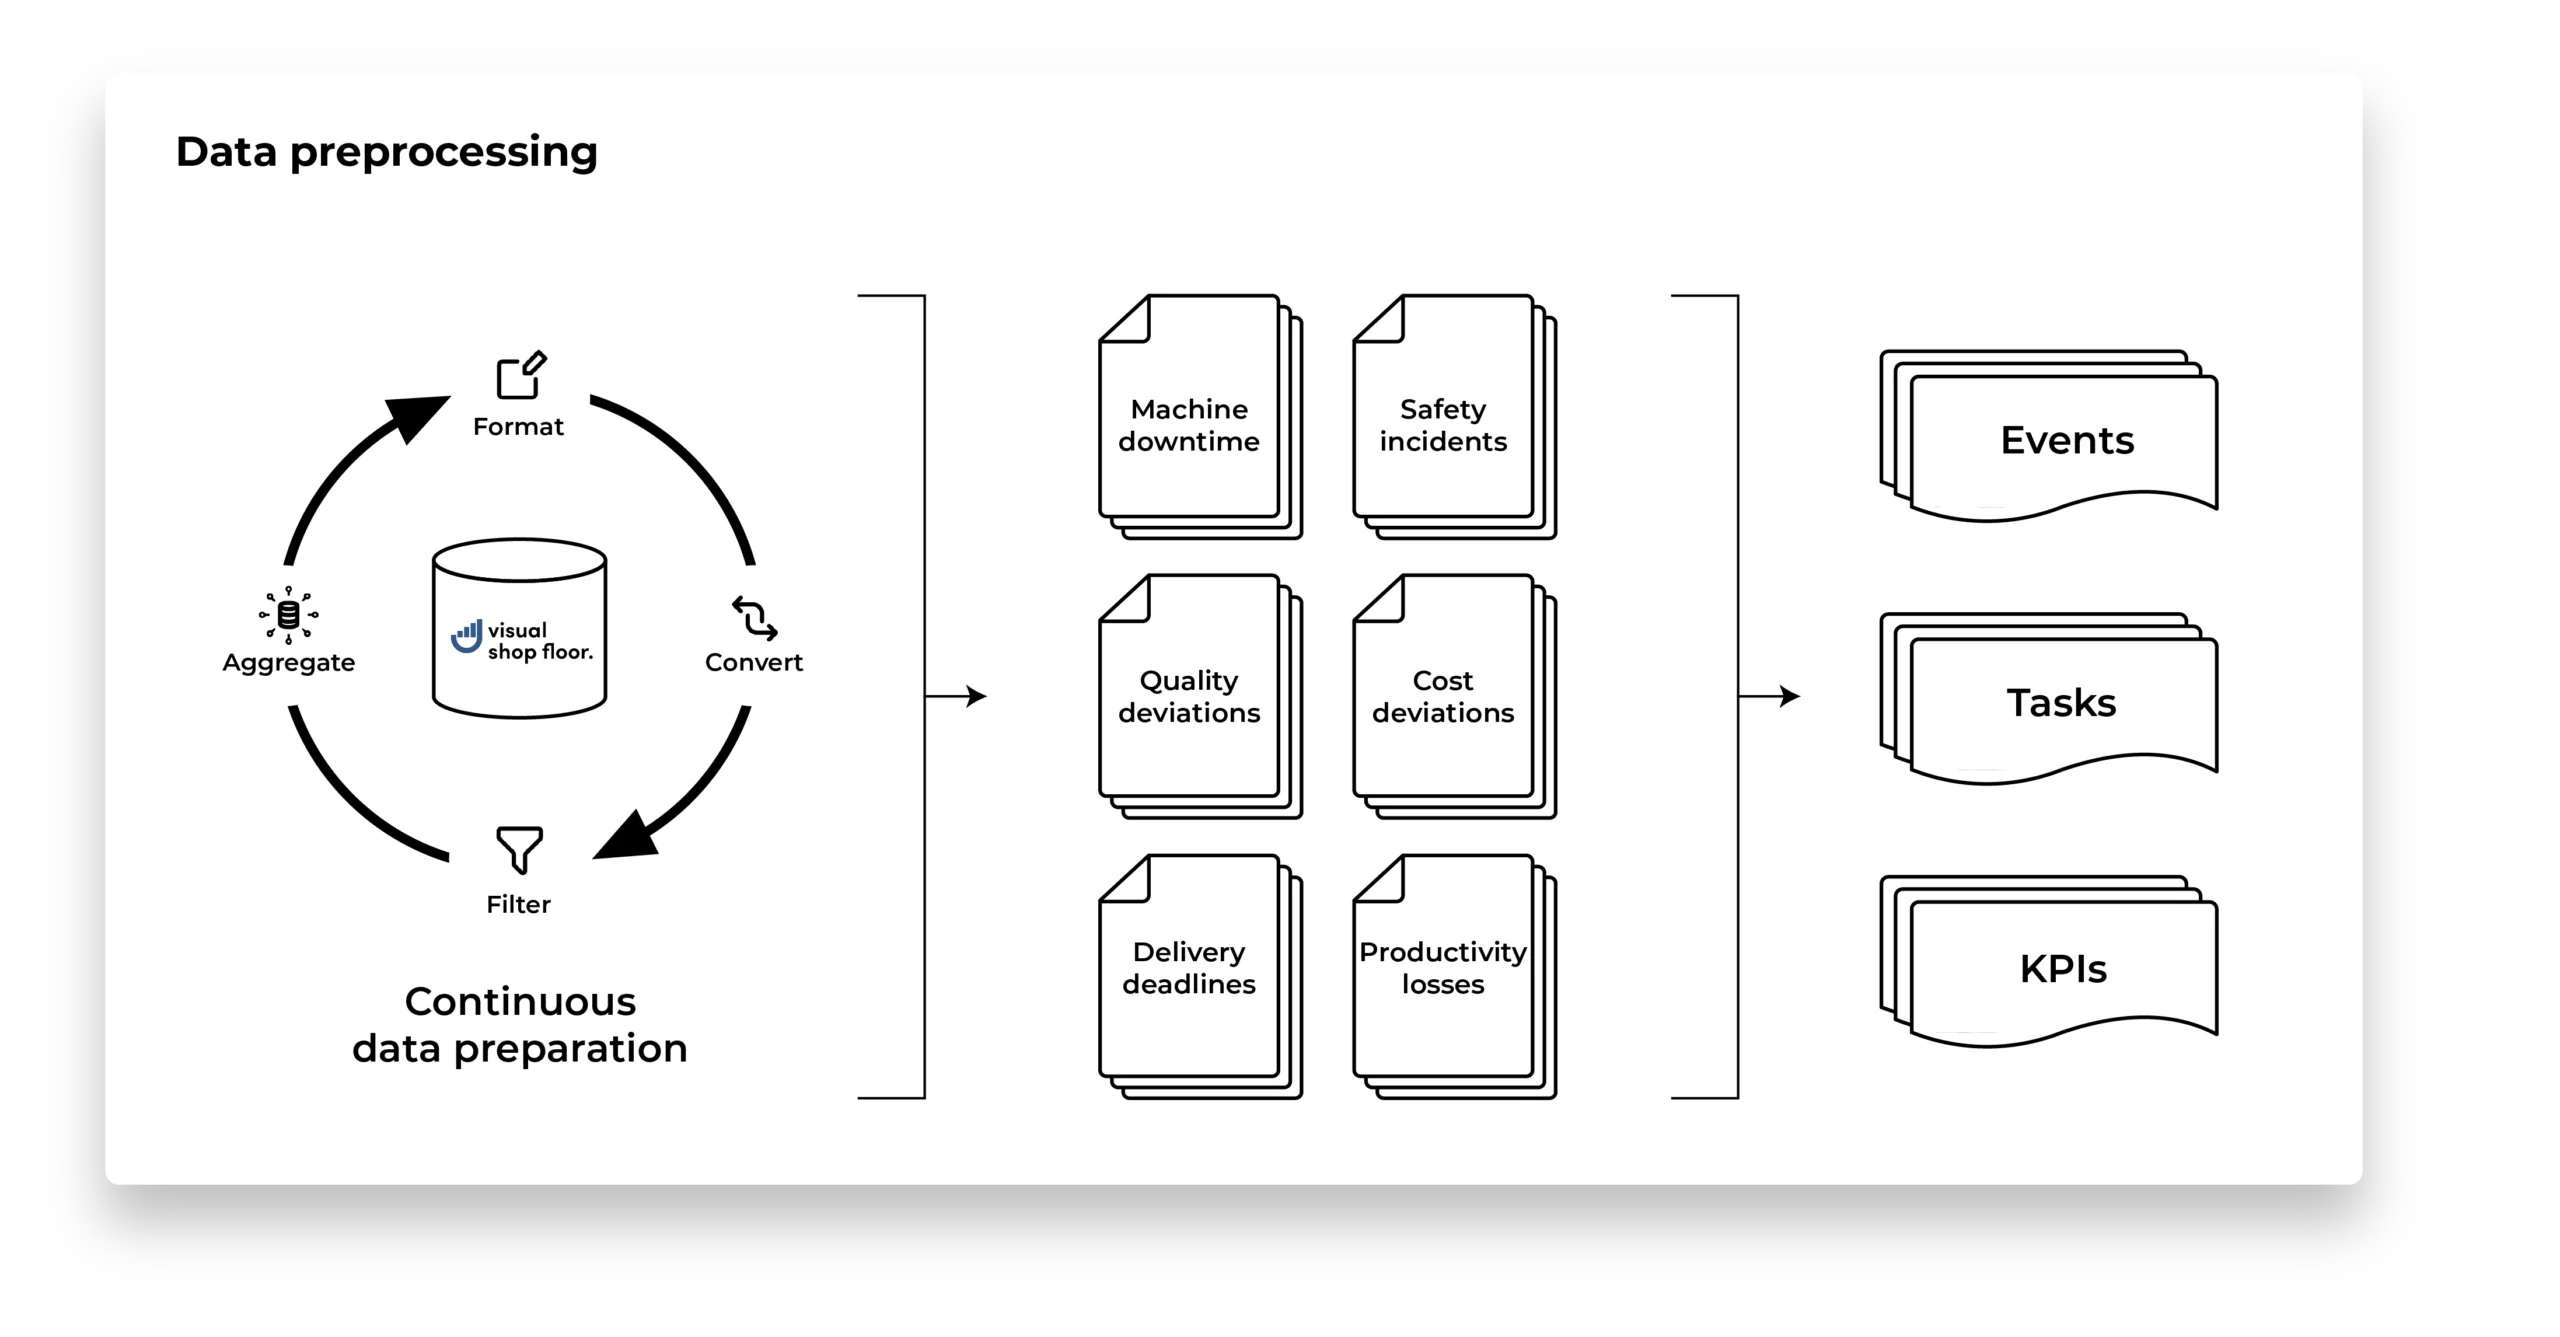
4.2 Data preprocessing
Visual Shop Floor provides a stepwise processing pipeline in which raw data from various sources – machines, sensors, files, or interfaces – is technically prepared.
In the first step, data is converted into uniform formats, and erroneous or incomplete values are corrected. Subsequently, the data is harmonized and linked to establish relationships between information from potentially different sources and to place it within a common context.
Based on this foundation, application-specific KPIs can be derived – from basic metrics such as downtime or scrap rates to more complex indicators like OEE or CPK values. The goal is to create a consolidated data model that can be used both as the basis for real-time visualization and for historical analyses.
In the customer project, data from MES, ERP, CAQ, and EHS systems were integrated to provide a comprehensive representation of the production processes. The data was automatically retrieved at predefined intervals, cleaned and standardized through specific pipeline steps (user-definable functions), and linked using master data (orders, machine IDs, shifts). An overarching data validation process ensured that erroneous or duplicate records were identified and corrected.
Building on the prepared raw data, the transformation into concrete KPIs was carried out. Meaningful indicators were derived from continuously updated process values.
In parallel, anomaly and deviation detection was implemented using defined rule-based mechanisms. This allowed, for example, machine downtimes exceeding specified thresholds, clusters of quality deviations, or safety-relevant incidents to be automatically detected and recorded as structured events.
These events were categorized using thresholds and classification rules and enriched with additional contextual information such as causes, tasks, or responsibilities.
This resulted in a consistently structured and validated data foundation, which serves as the basis for real-time visualization on the SQCDP board and for event-driven actions in shop floor management.
4.3 SQCDP Board user interface
A wide range of components is available – from interactive charts and KPI widgets to event and task elements, as well as the display of documents, images, or videos. In addition, input widgets can be used to capture data directly within the dashboard, centrally consolidating KPIs, events, and tasks.
Thanks to the no-code/low-code approach, layouts, data sources, and widgets can be adjusted without programming skills. This allows user interfaces to be quickly adapted to new requirements, increasing user acceptance while ensuring that all relevant information is displayed in real time and in the correct context.
Based on this, the digital SQCDP board was implemented with Visual Shop Floor. The dashboard consolidates all information from the five focus areas Safety, Quality, Cost, Delivery, and Productivity on a central interface and serves as a daily control and analysis tool. It forms the basis for regular shop floor meetings, supports monitoring of production performance, and creates a shared understanding of the current situation.
The flexible design options allowed for precise adaptation to the company’s requirements. Each focus area was individually defined, structured, and linked to the relevant KPIs, charts, and event information. This resulted in an intuitive and consistently structured user interface, enabling rapid comprehension and interpretation, and supporting data-driven decision-making in the daily production environment.
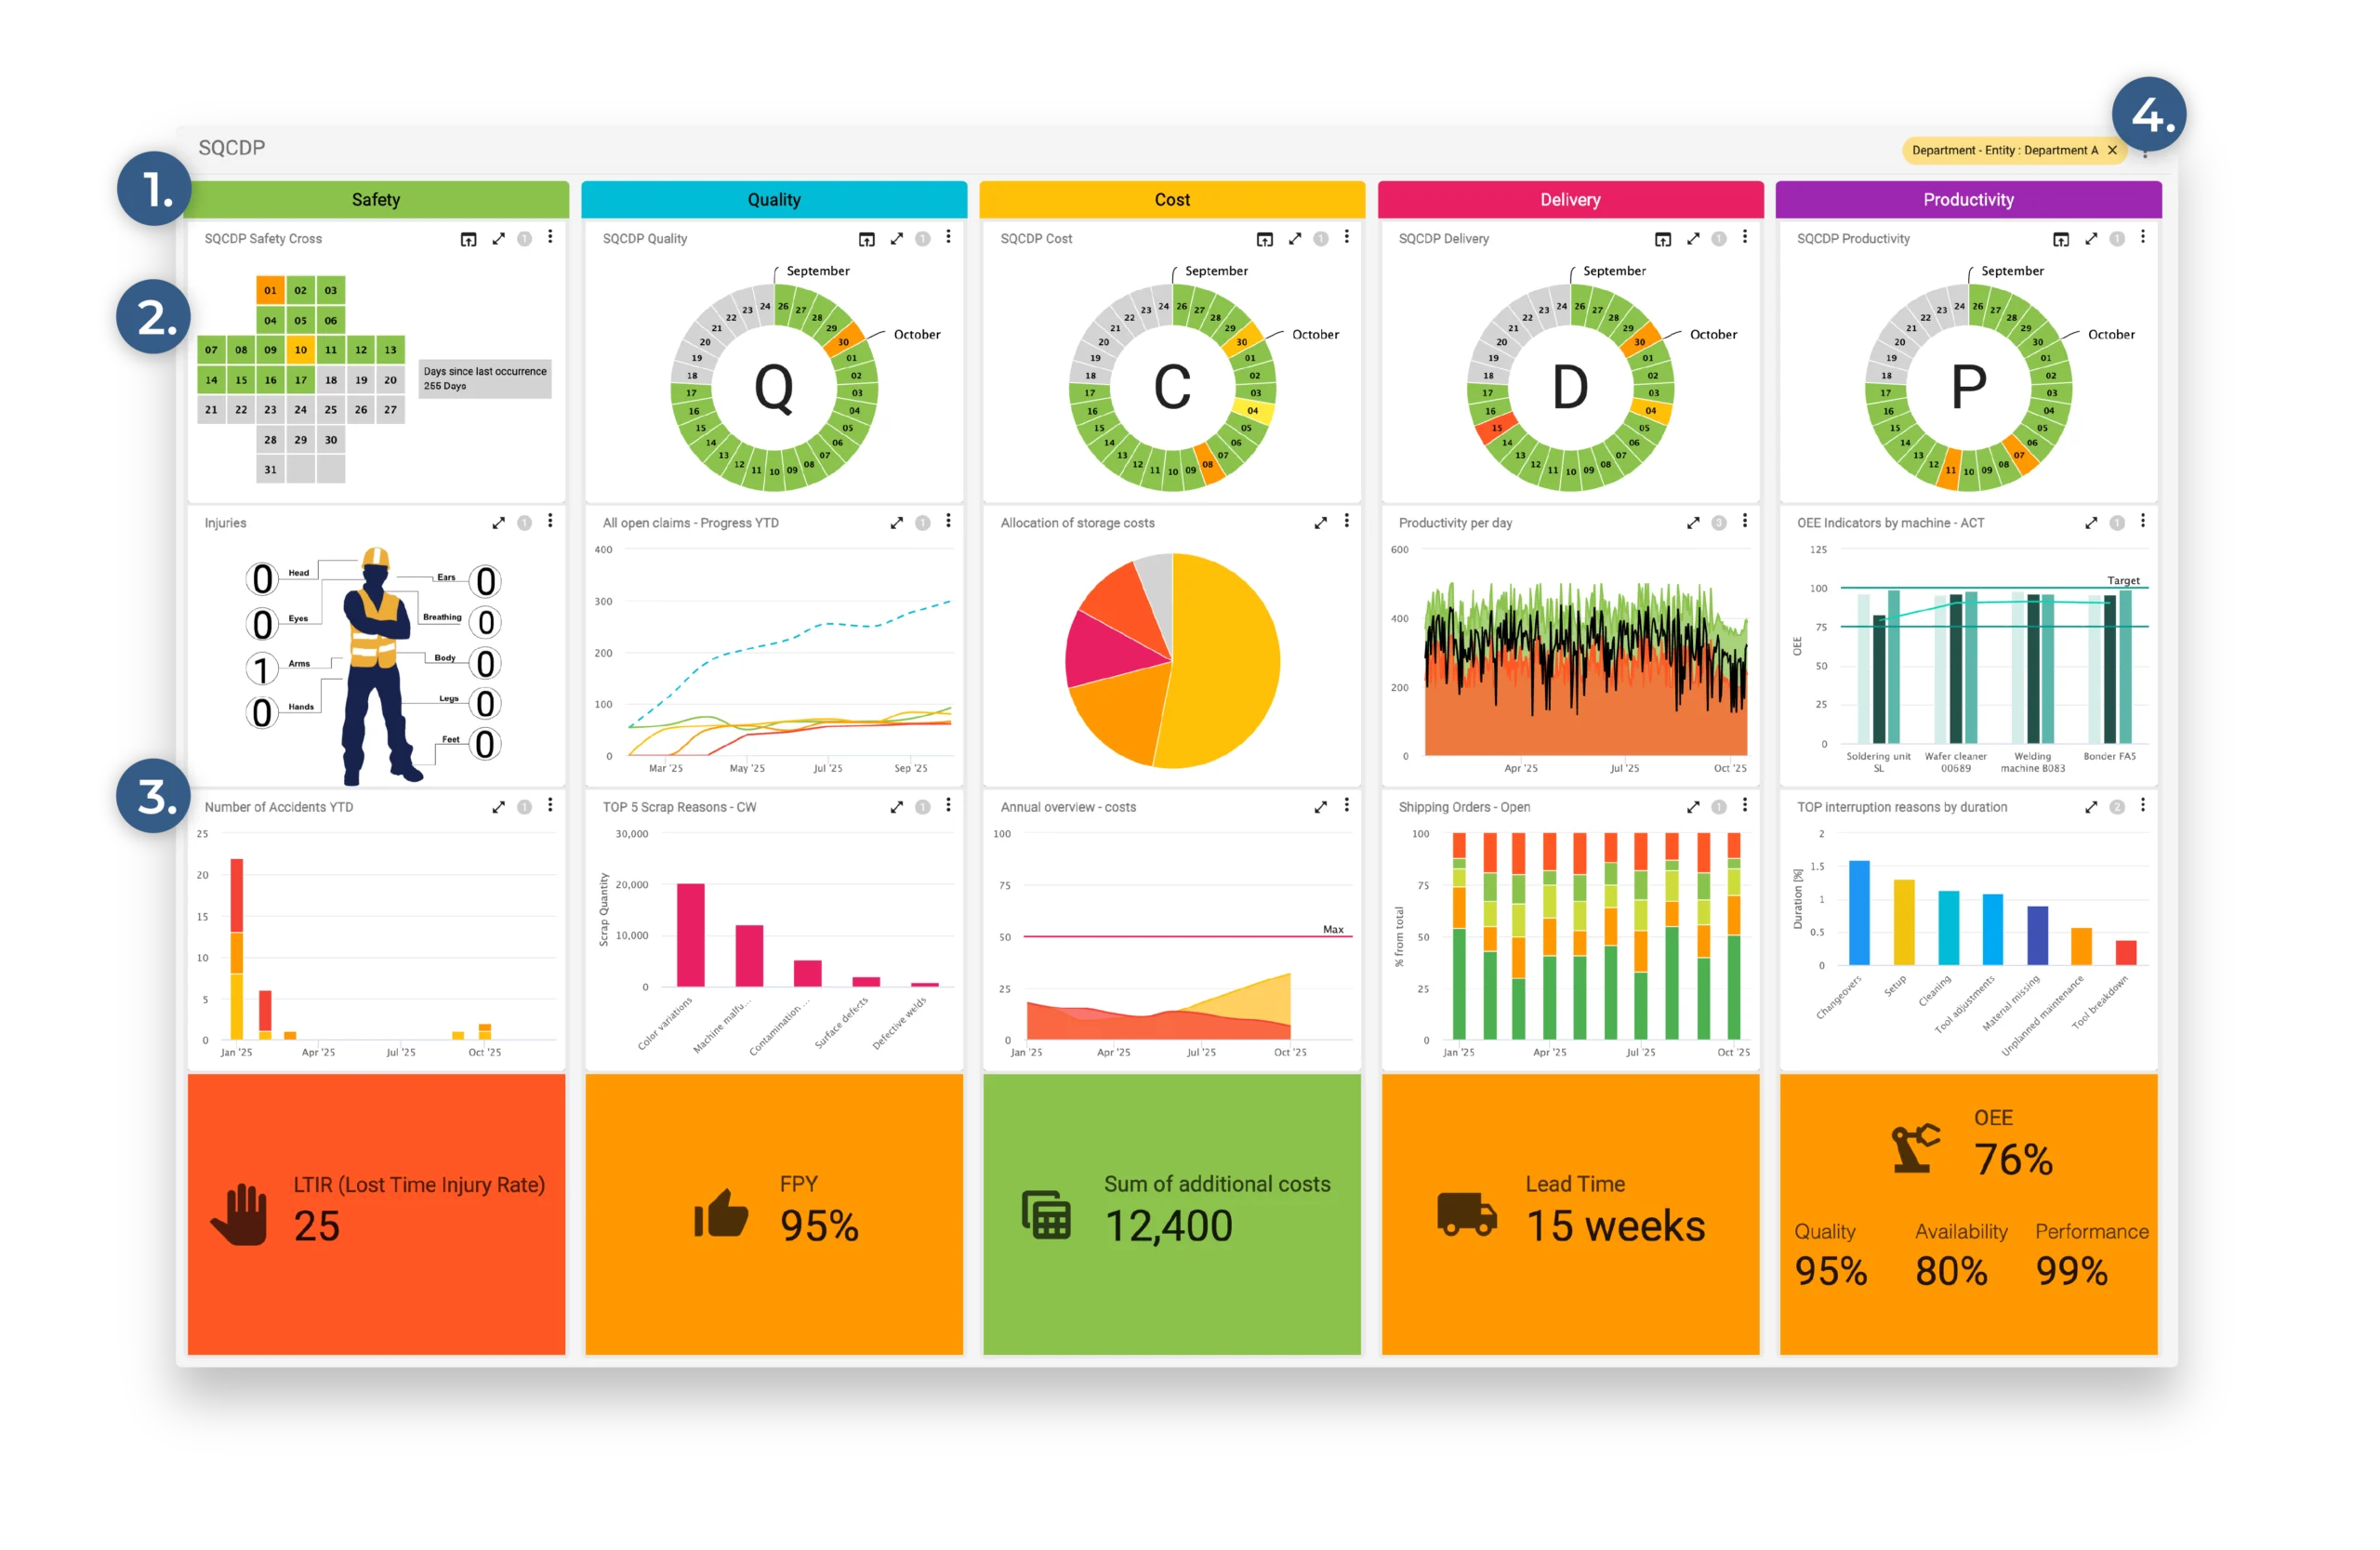
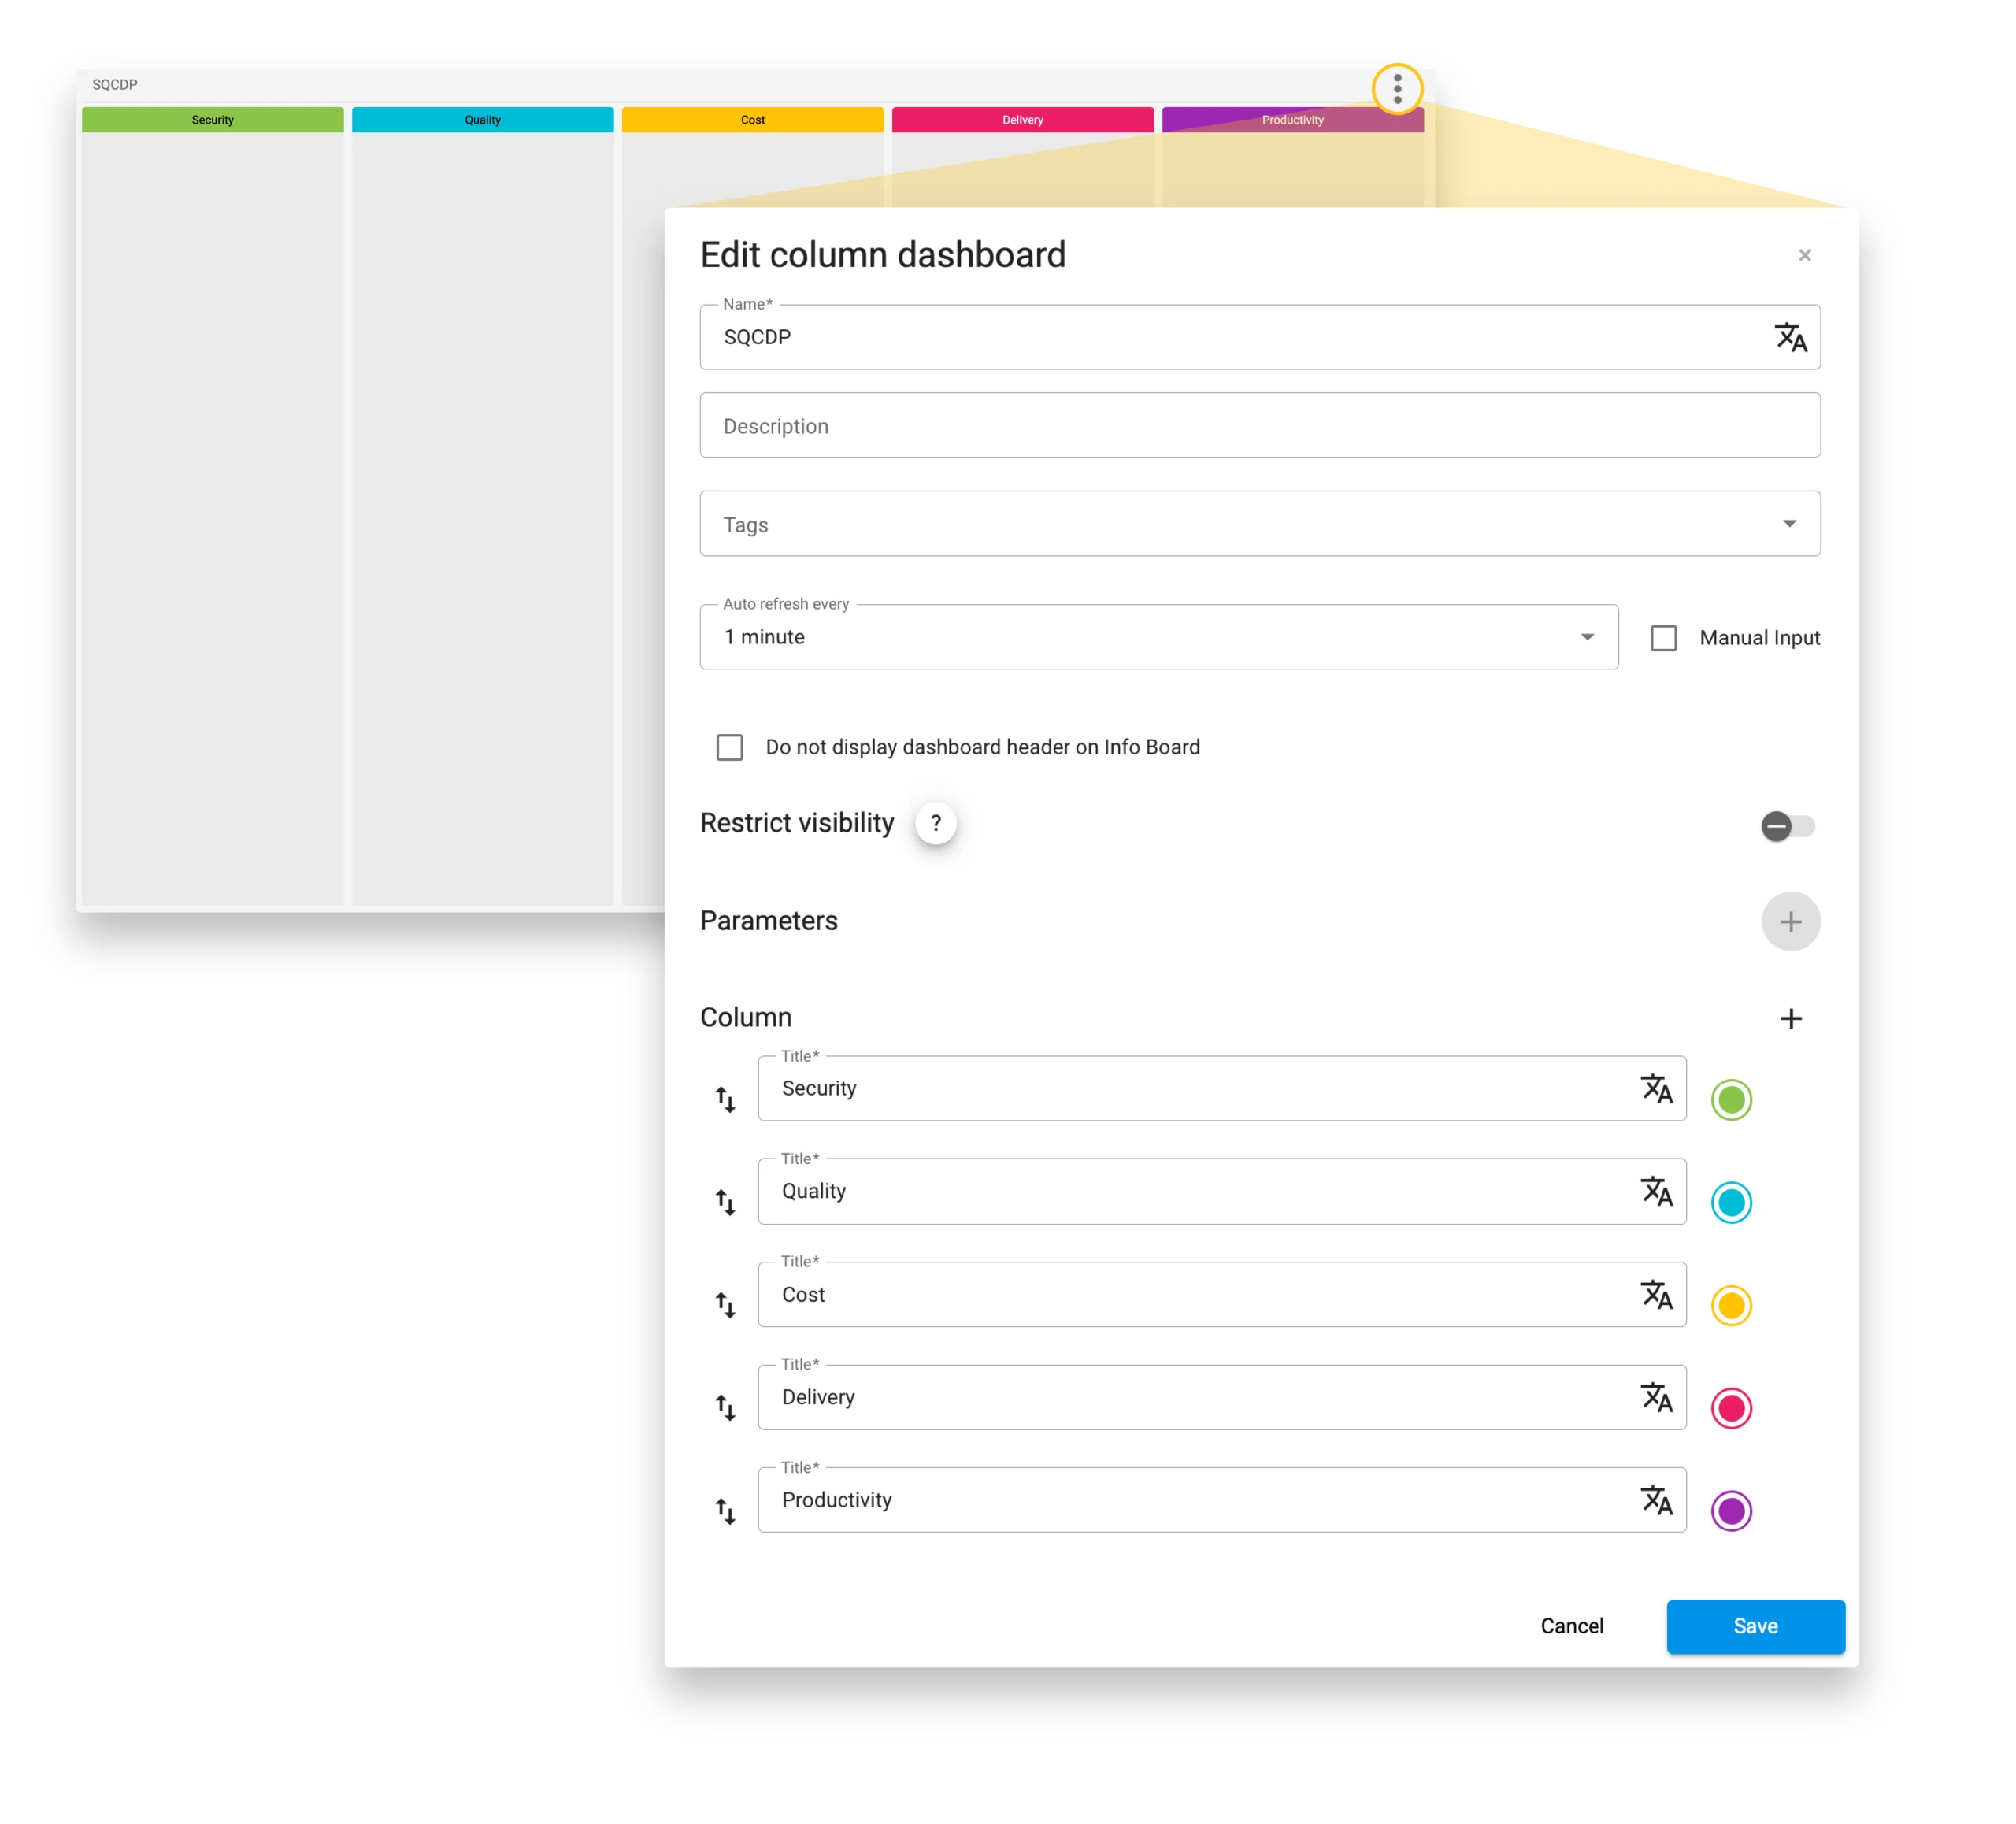
4.3.1 Column layout and display of SQCDP focus areas
The following columns were defined for the implementation:
- Safety: Accidents, safety incidents, lost work time
- Quality: Scrap, rework, customer complaints
- Cost: Material, energy, and process costs
- Delivery: On-time delivery, delivery performance, lead times
- Productivity: Productivity metrics (e.g., output quantity, shift performance)
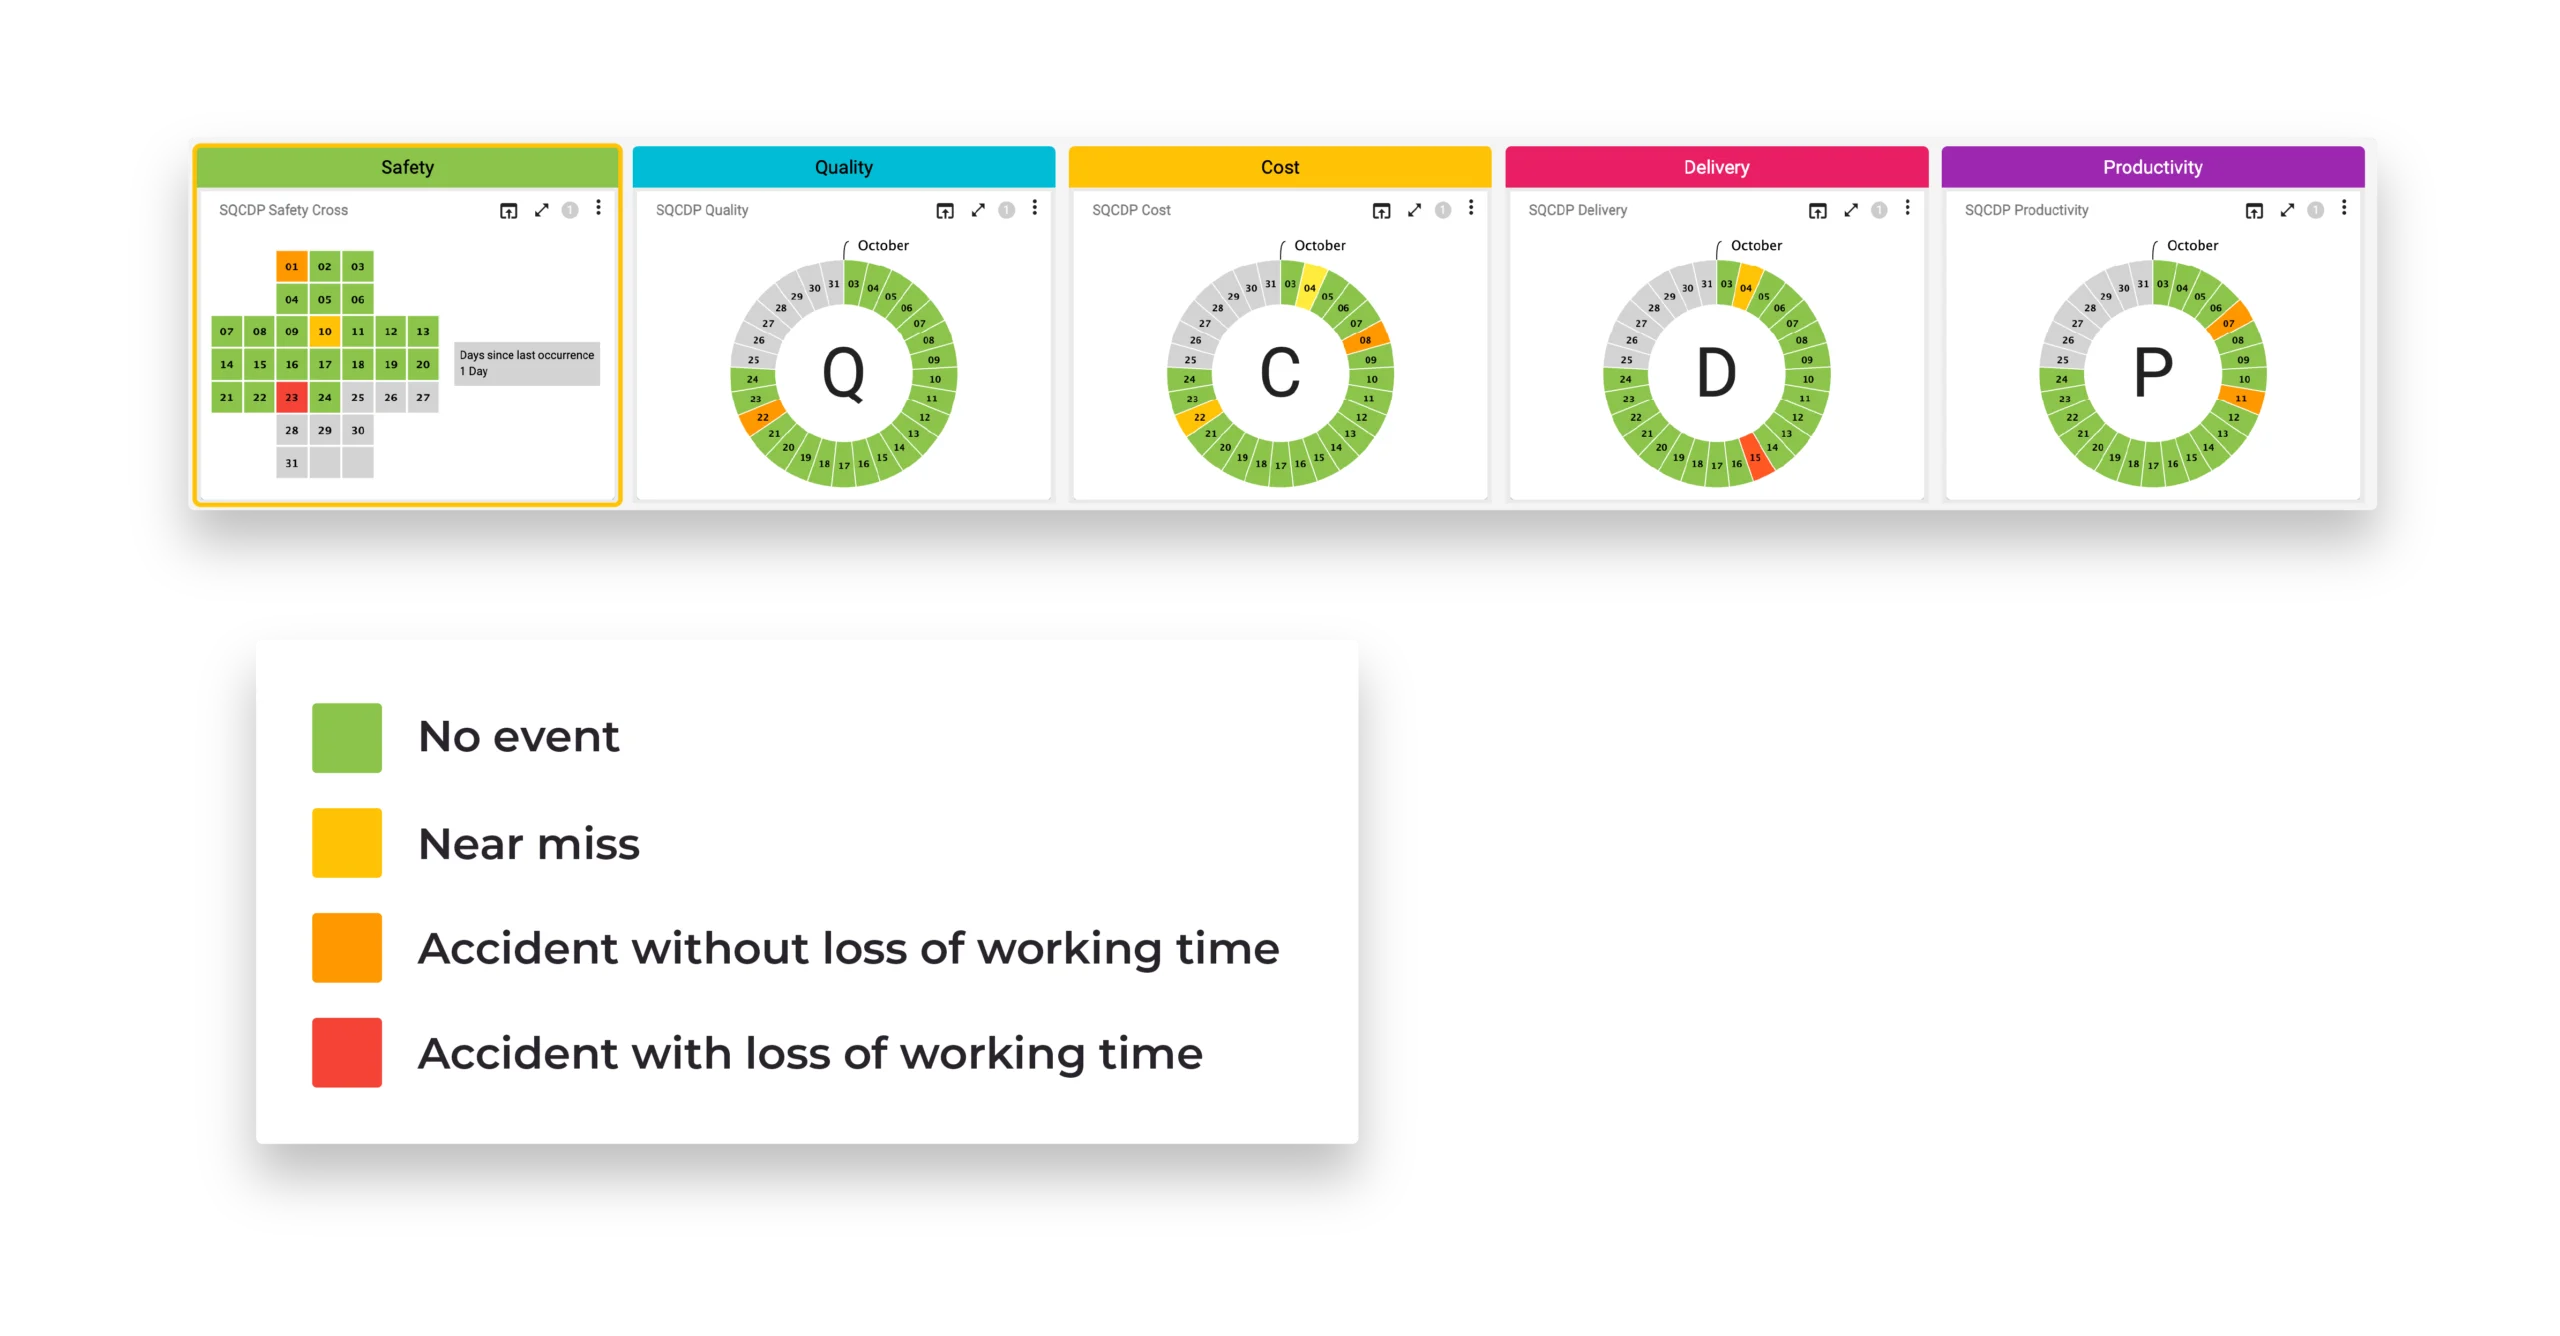
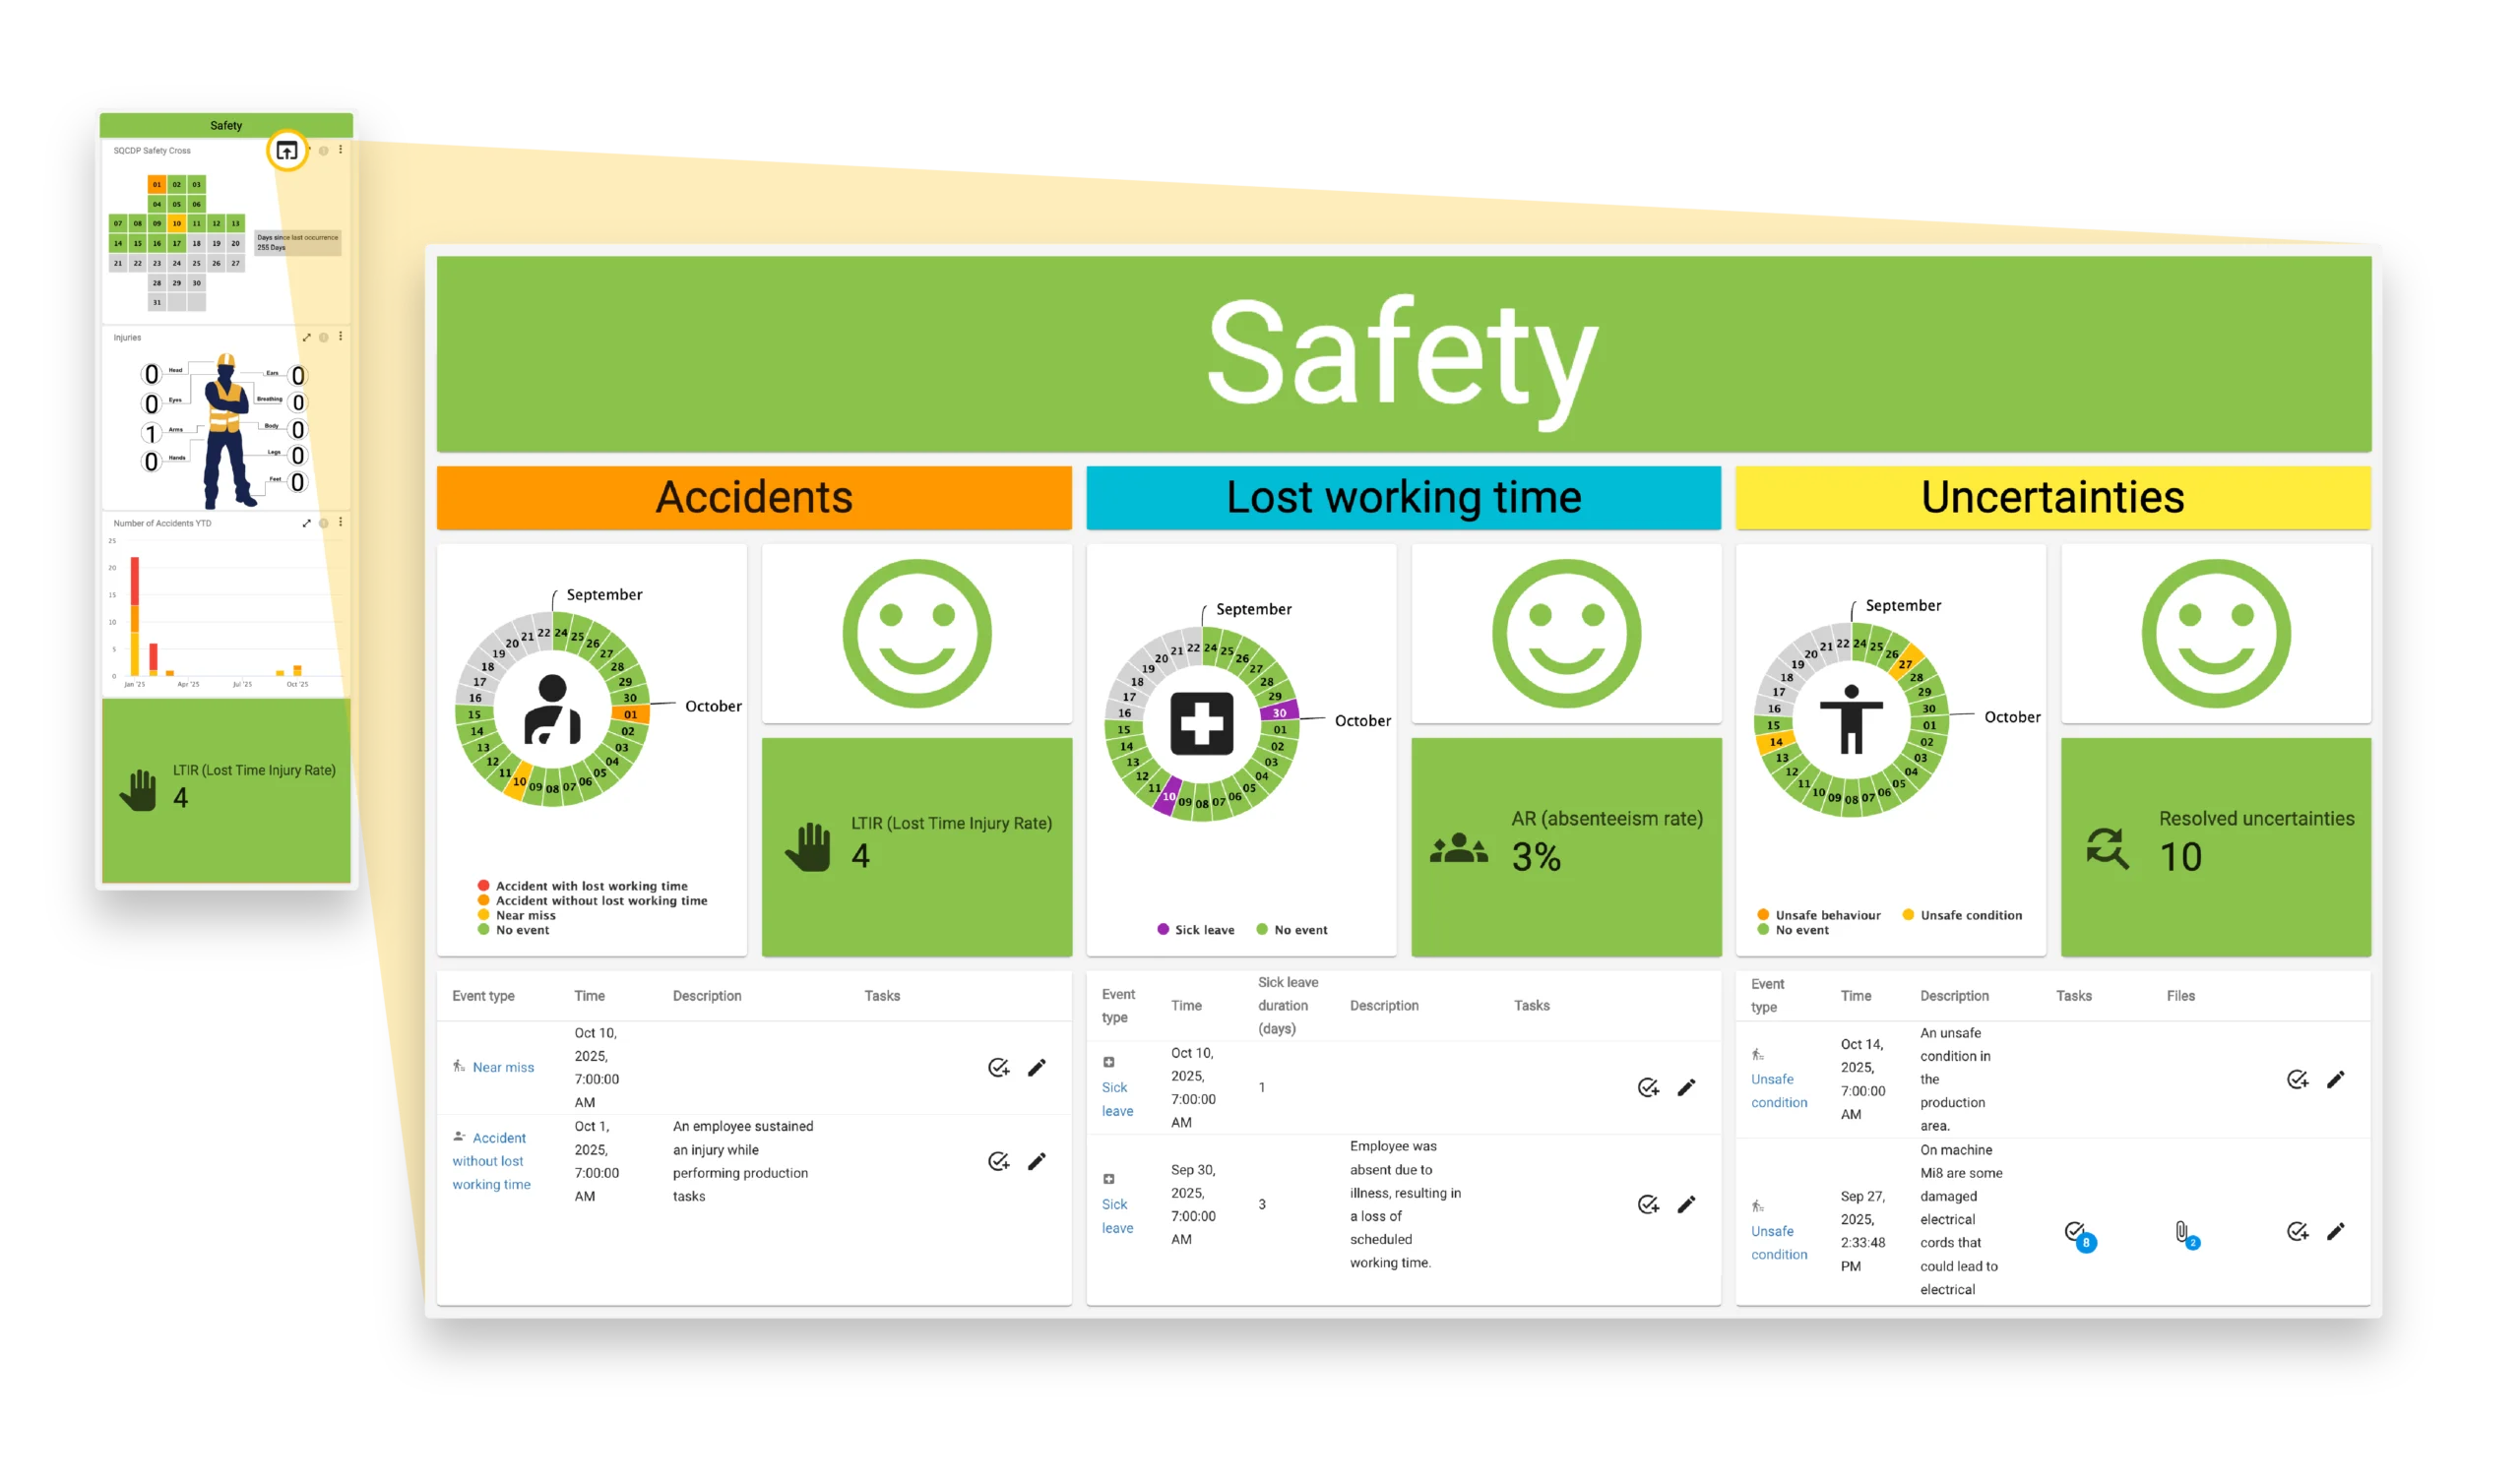
4.3.2 Safety cross and event wheels
- A safety cross is used for Safety.
- Event wheels are used for the other areas.
- Green: No incidents
- Yellow / Orange / Red: Deviations of varying severity
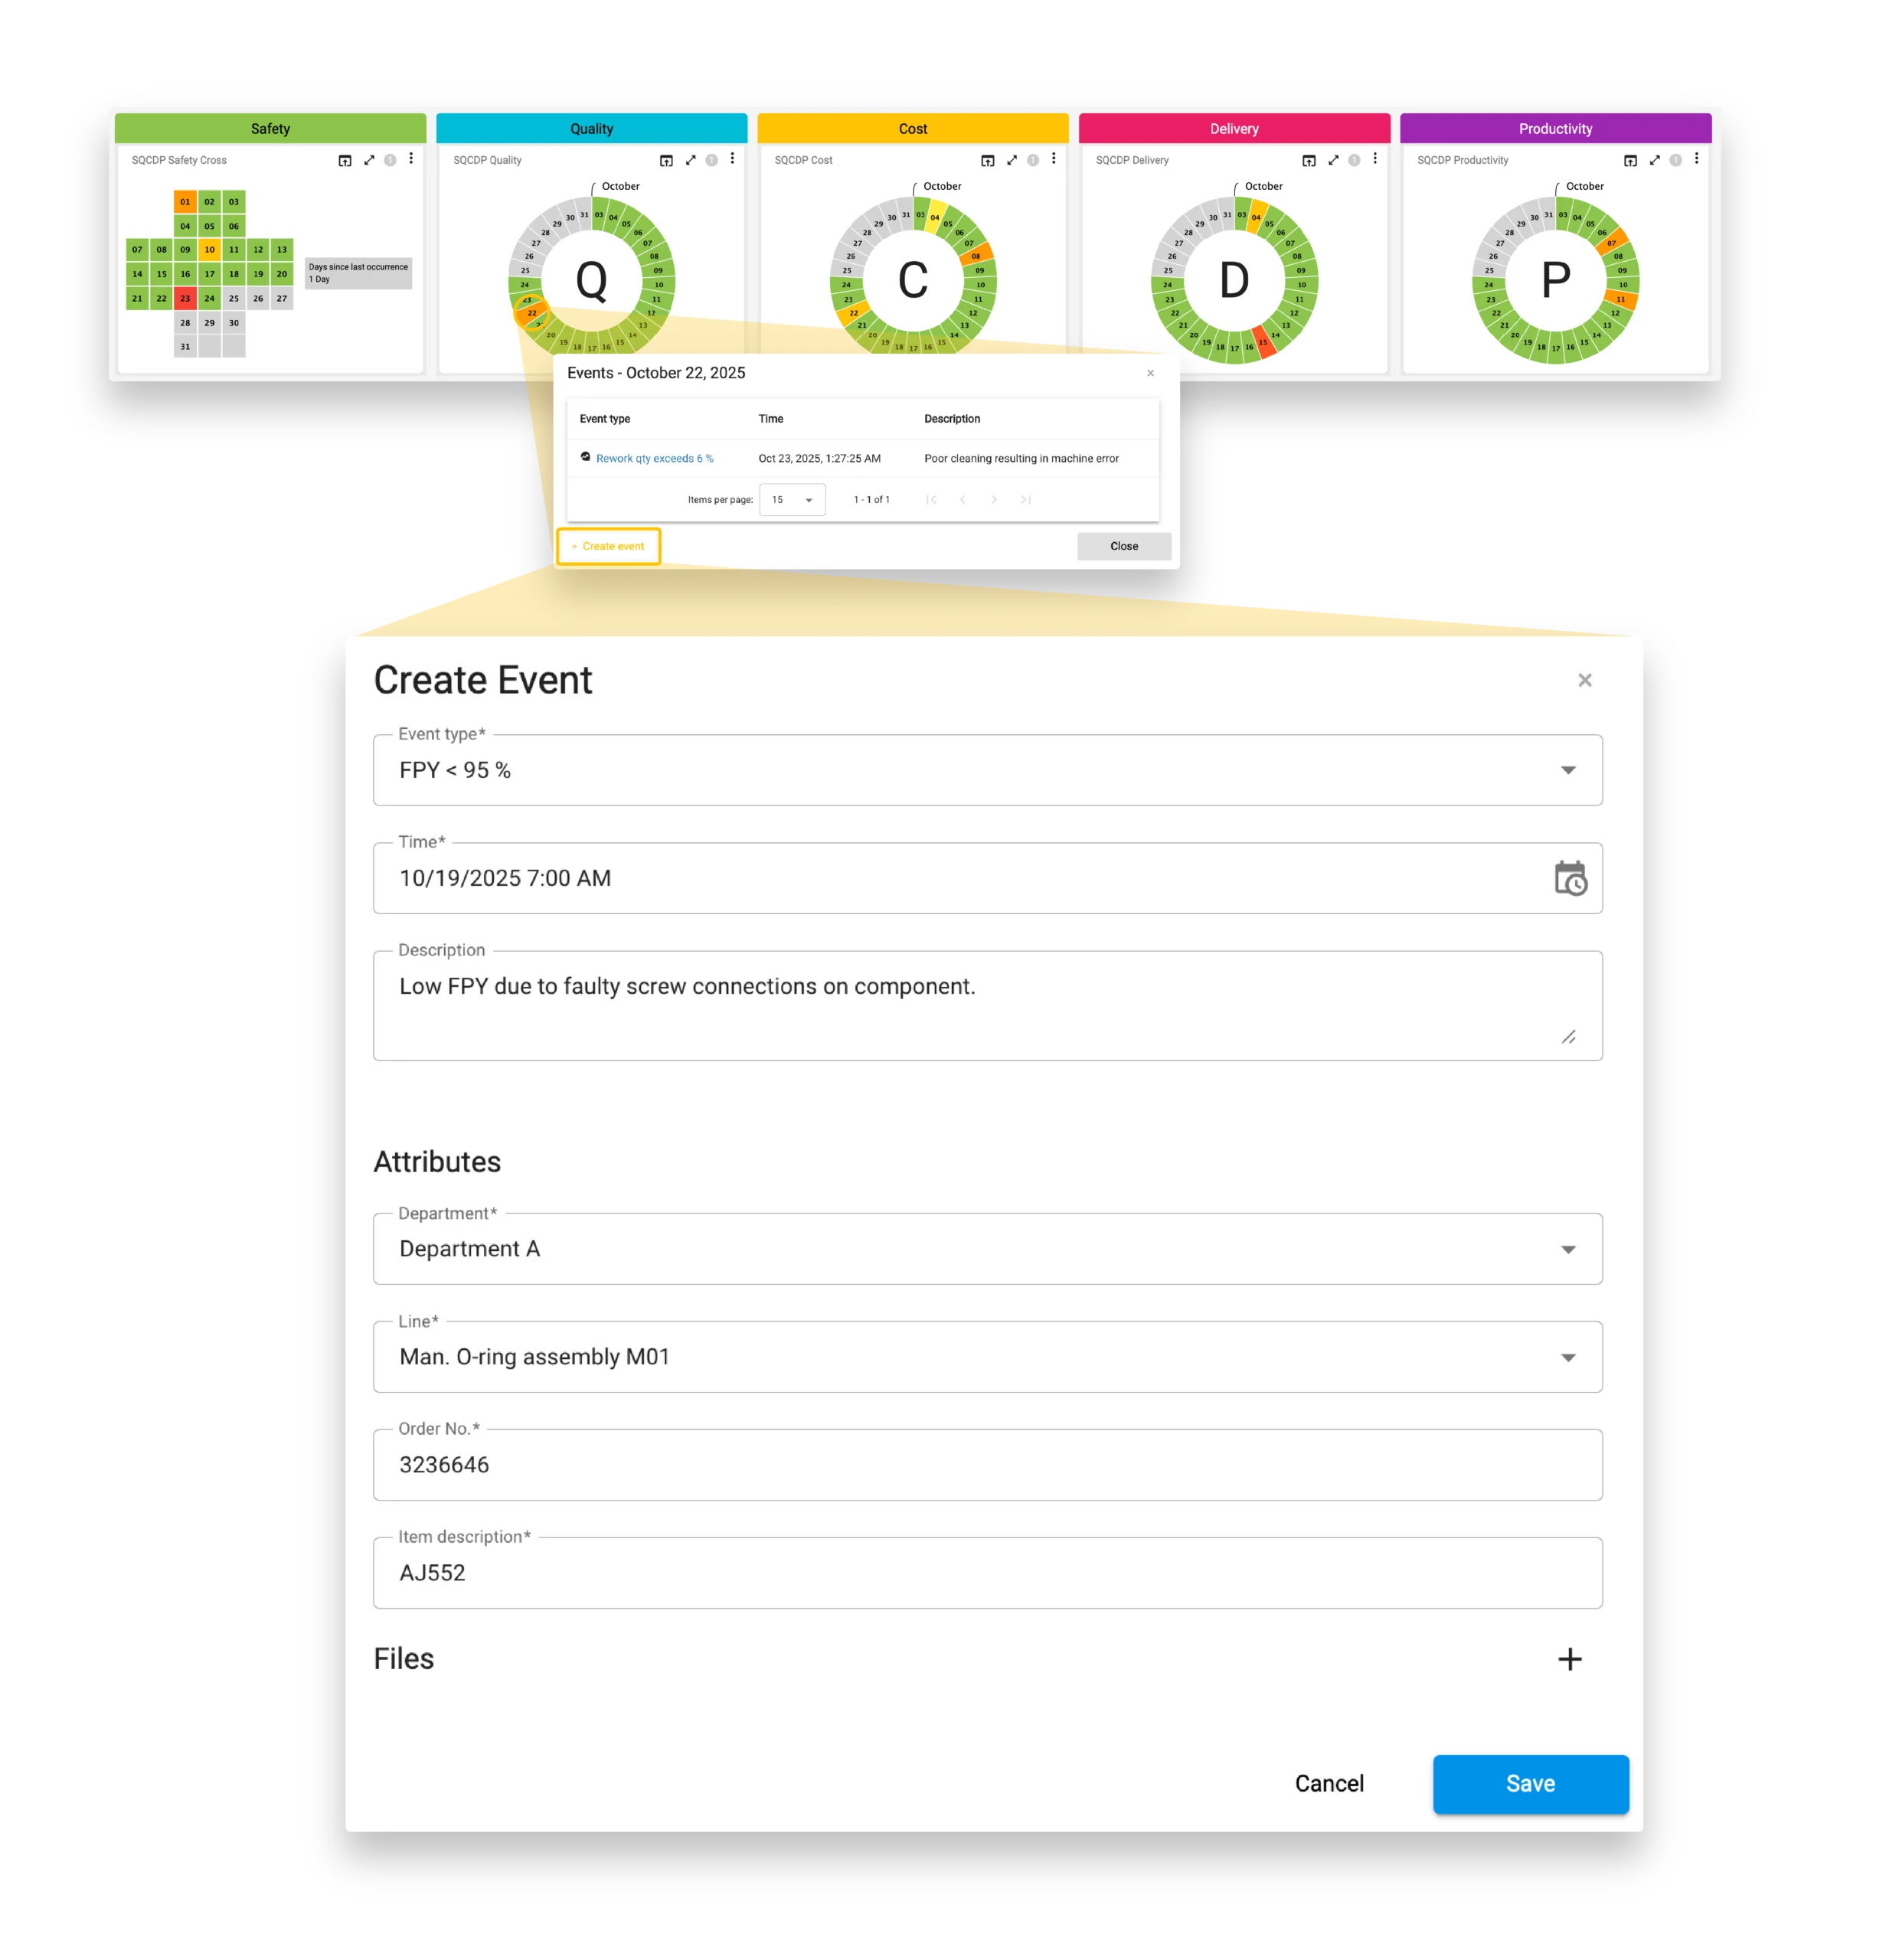
Events can originate in three ways:
- Automatically through rule-based mechanisms (thresholds or limit violations)
- Manually via the Create Event dialog
- Through interfaces from connected third-party systems (e.g., CAQ or EHS)
- Quality: "Good part ratio < 97 %"
- Safety: "Machine pressure > 110 % of nominal operating pressure"
- Productivity: "Downtime > 10 minutes without explanation"
- Select the event type
- Provide a description
- Assign the event precisely using attributes (line, machine, department)
- Attach documents or photos
4.3.3 KPI visualization
Visual Shop Floor provides a wide range of flexibly configurable widgets that display information from various sources in real time, offering a transparent view of current performance across all levels.
With more than 20 widget types, KPIs can be visualized precisely and tailored to the specific needs. Suitable widgets can be assigned to each focus area, creating a well-structured and easily understandable overview.
Each column can be equipped with different visualization elements – from simple KPI indicators to charts and trend displays, as well as the integration of images or documents. This allows the board to be consistently aligned with the specific informational needs of different user groups and effectively supports data-driven decision-making and continuous improvement.
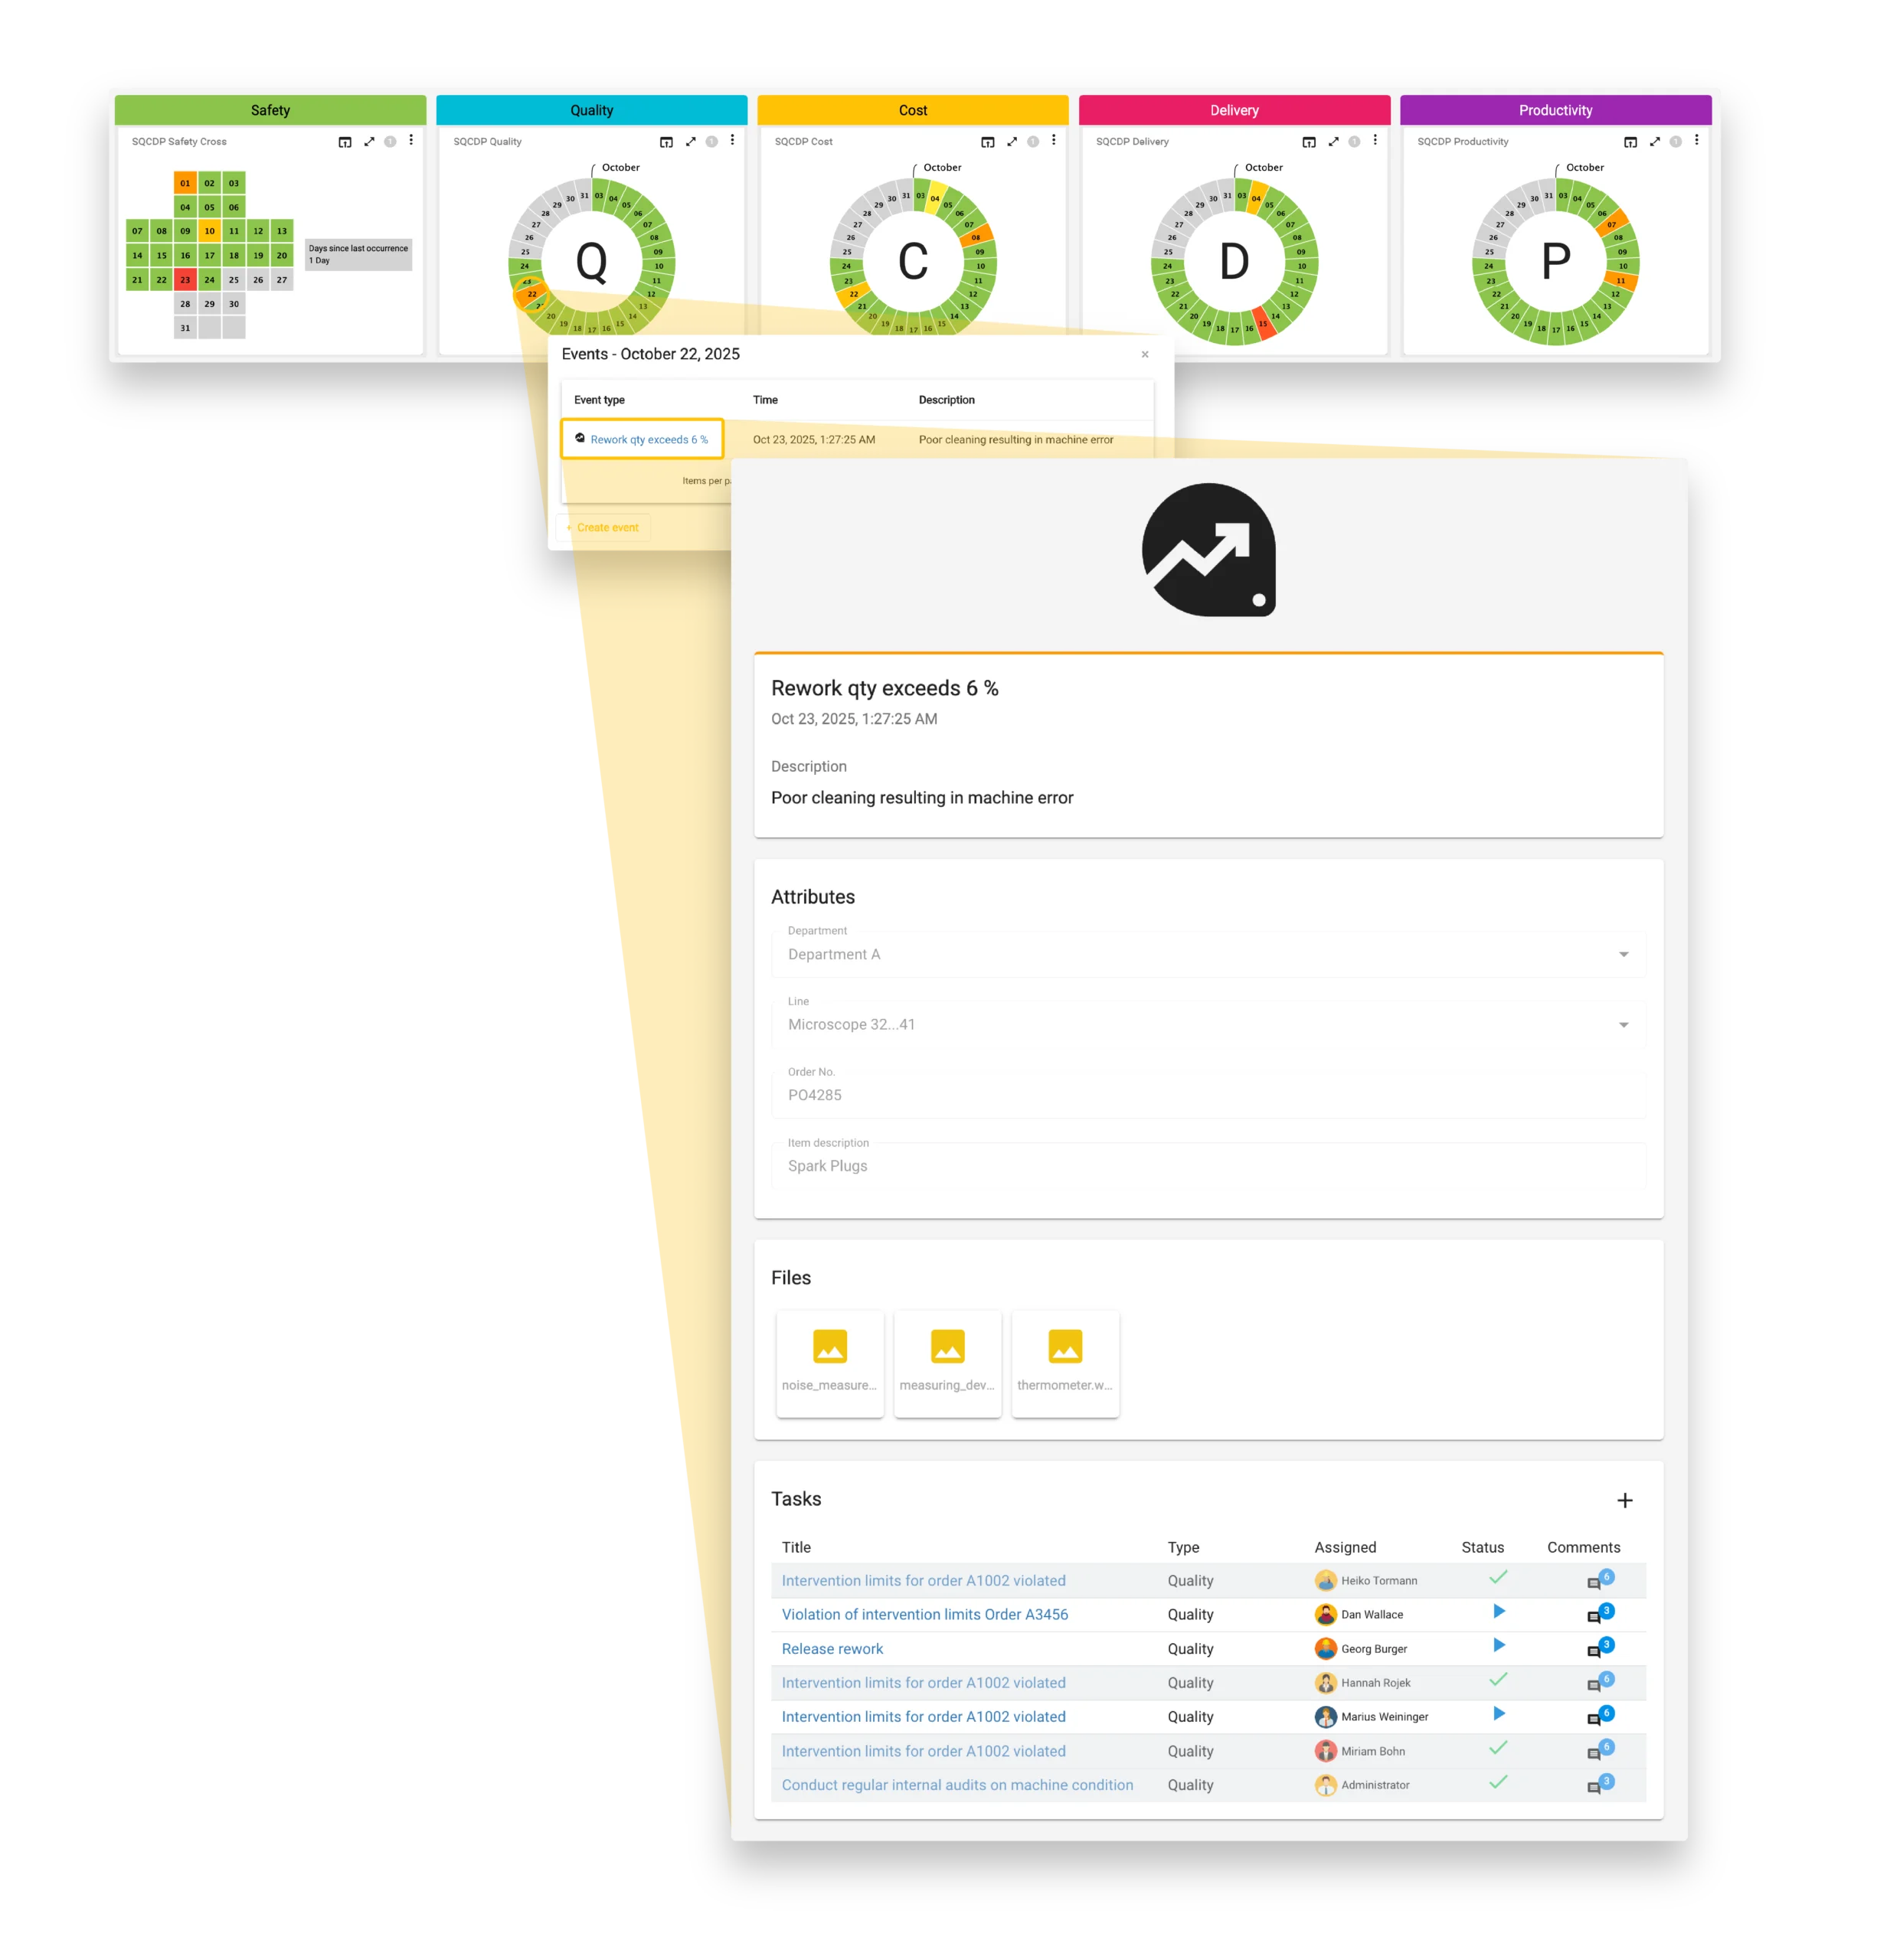
The detail pages are flexibly designed and enable targeted analyses, such as:
- Event evaluations by line, subprocess, or time period
- Task tracking through task widgets with status, responsible persons, and due dates
- Advanced KPI views with contextual data, trend series, or cause references
- Manual addition of information, comments, or files
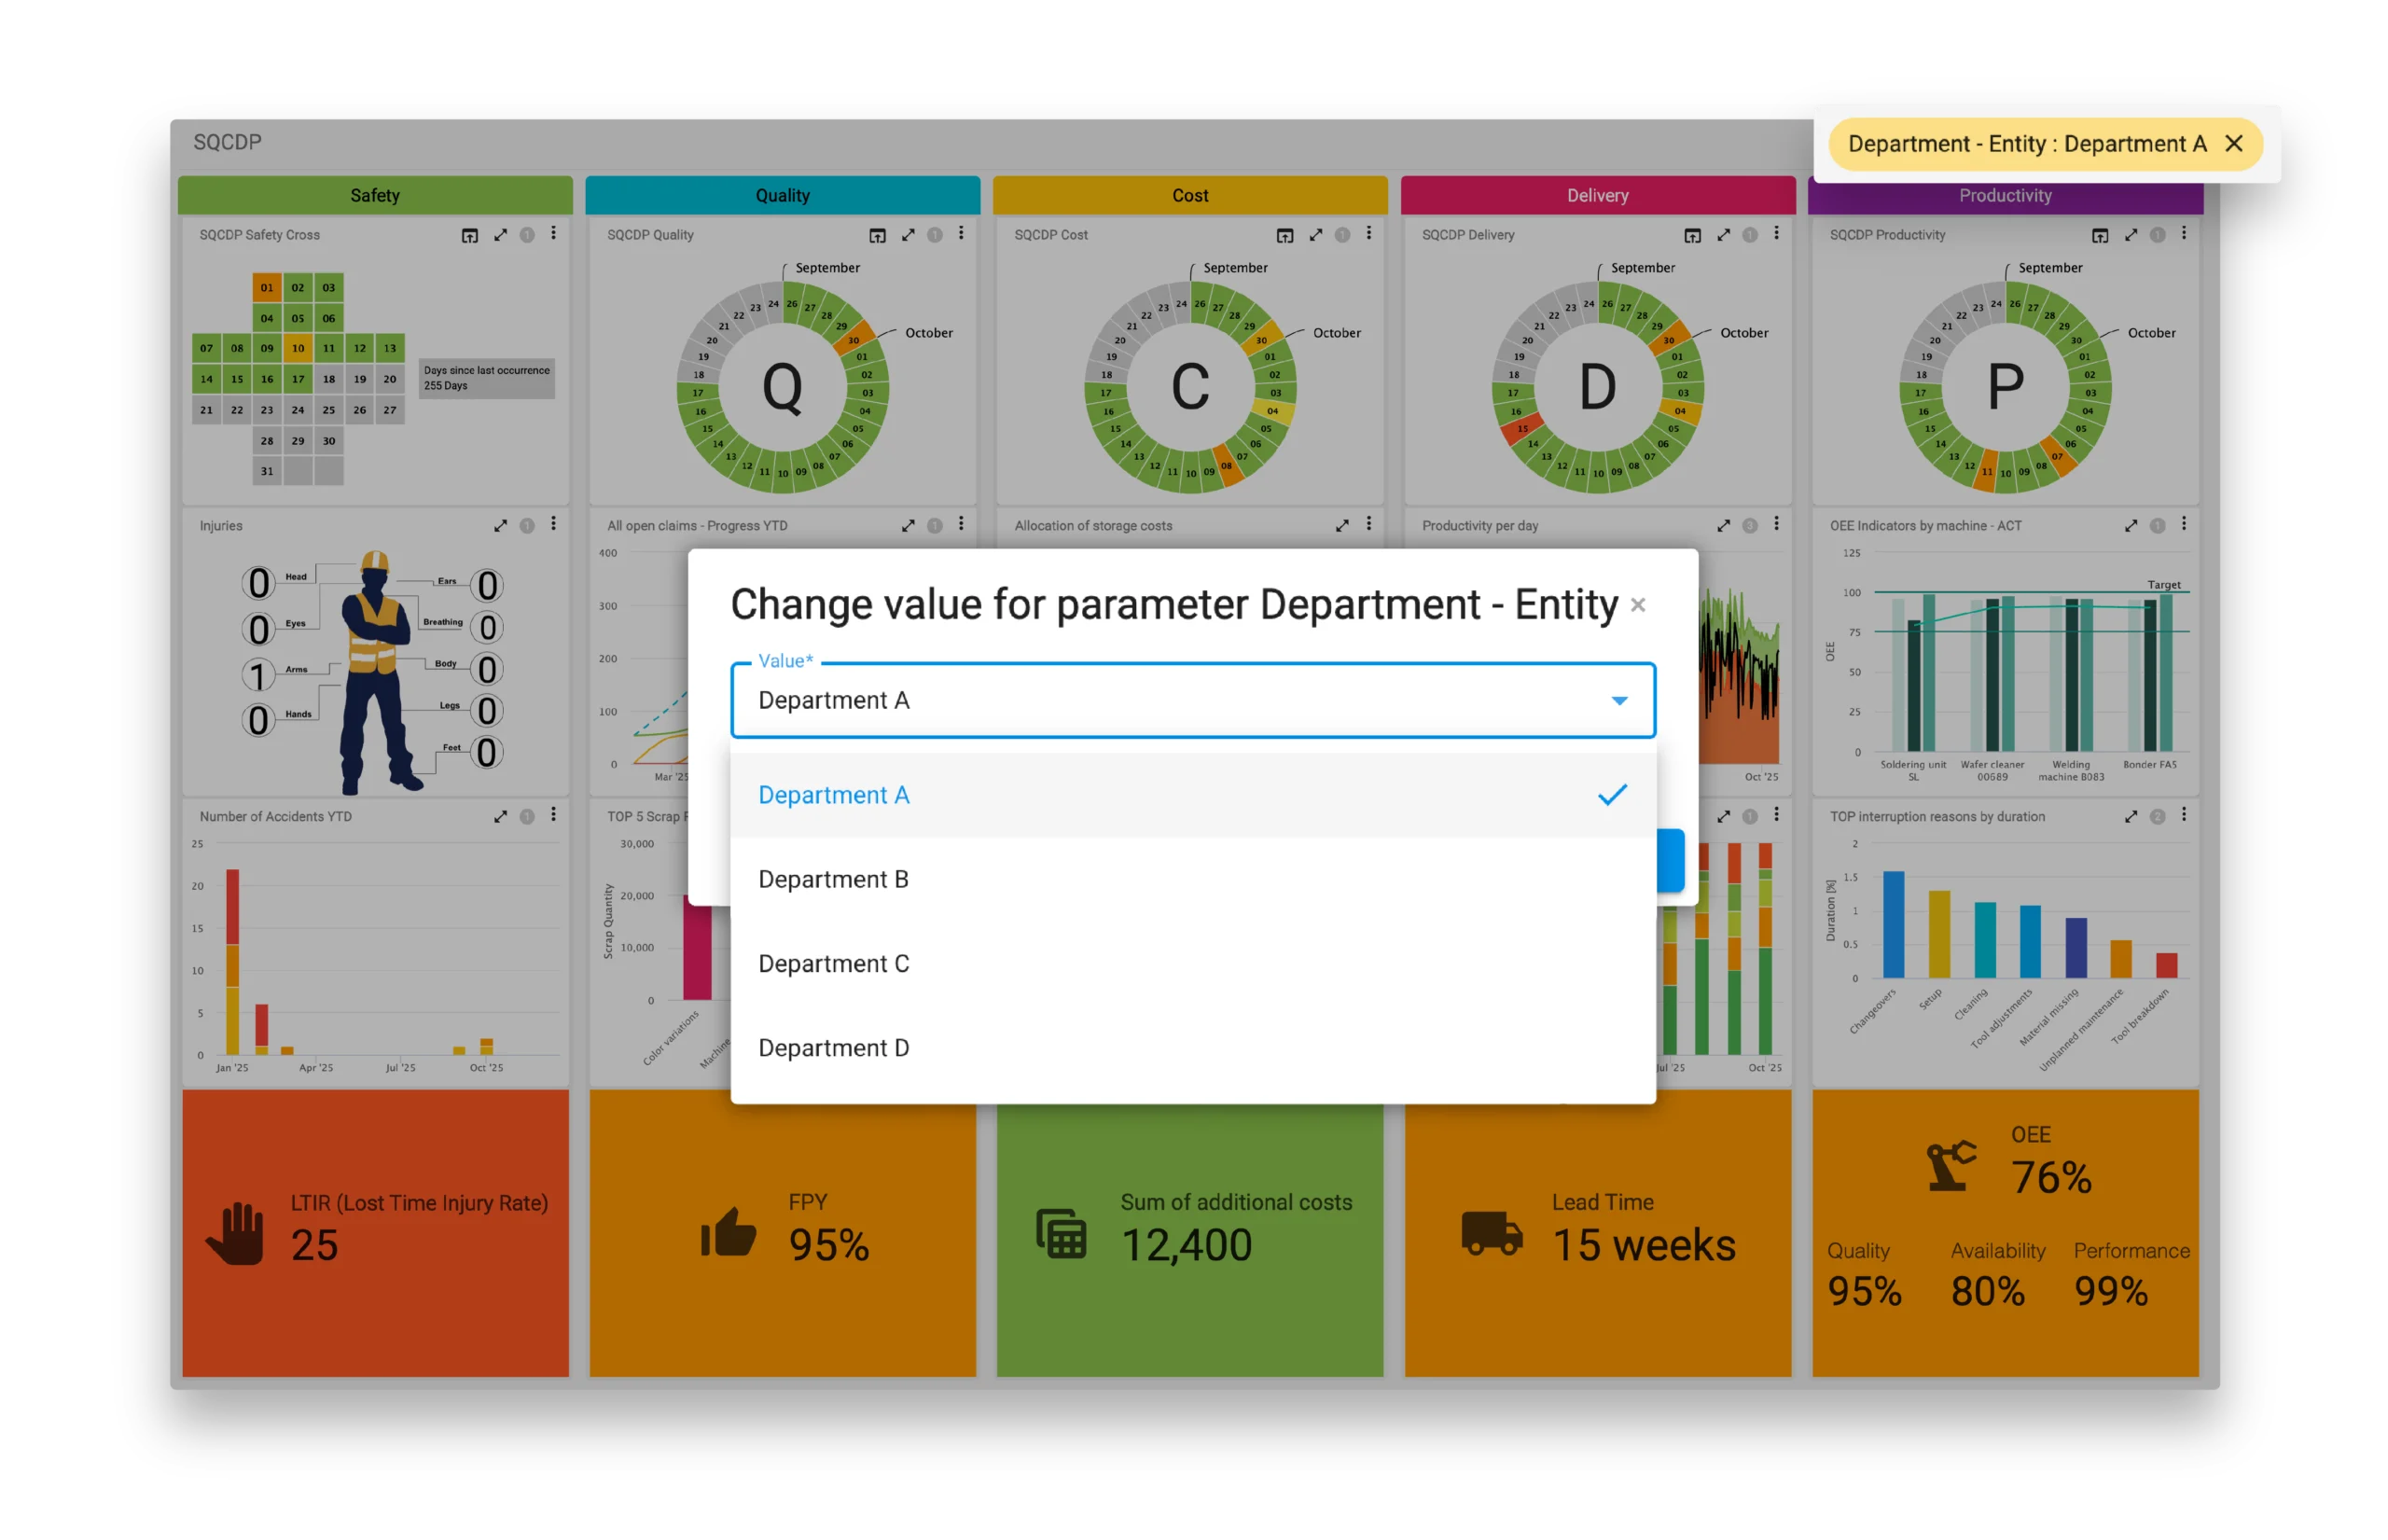
4.3.4 Content control via parameters
For example, when a specific department is selected, all visualizations update accordingly: events, KPIs, and trend charts relate exclusively to the chosen unit. Similarly, product- or area-specific views can be displayed without the need to maintain additional dashboards.
Parameters can be selected directly via filter elements on the board or automatically set using predefined default values (e.g., plant assignment). This functionality ensures that a centrally defined standard is maintained, while each organizational unit simultaneously receives a tailored, consistent, and always up-to-date view of its relevant SQCDP information.
4.4 System overview – structure and interaction of components
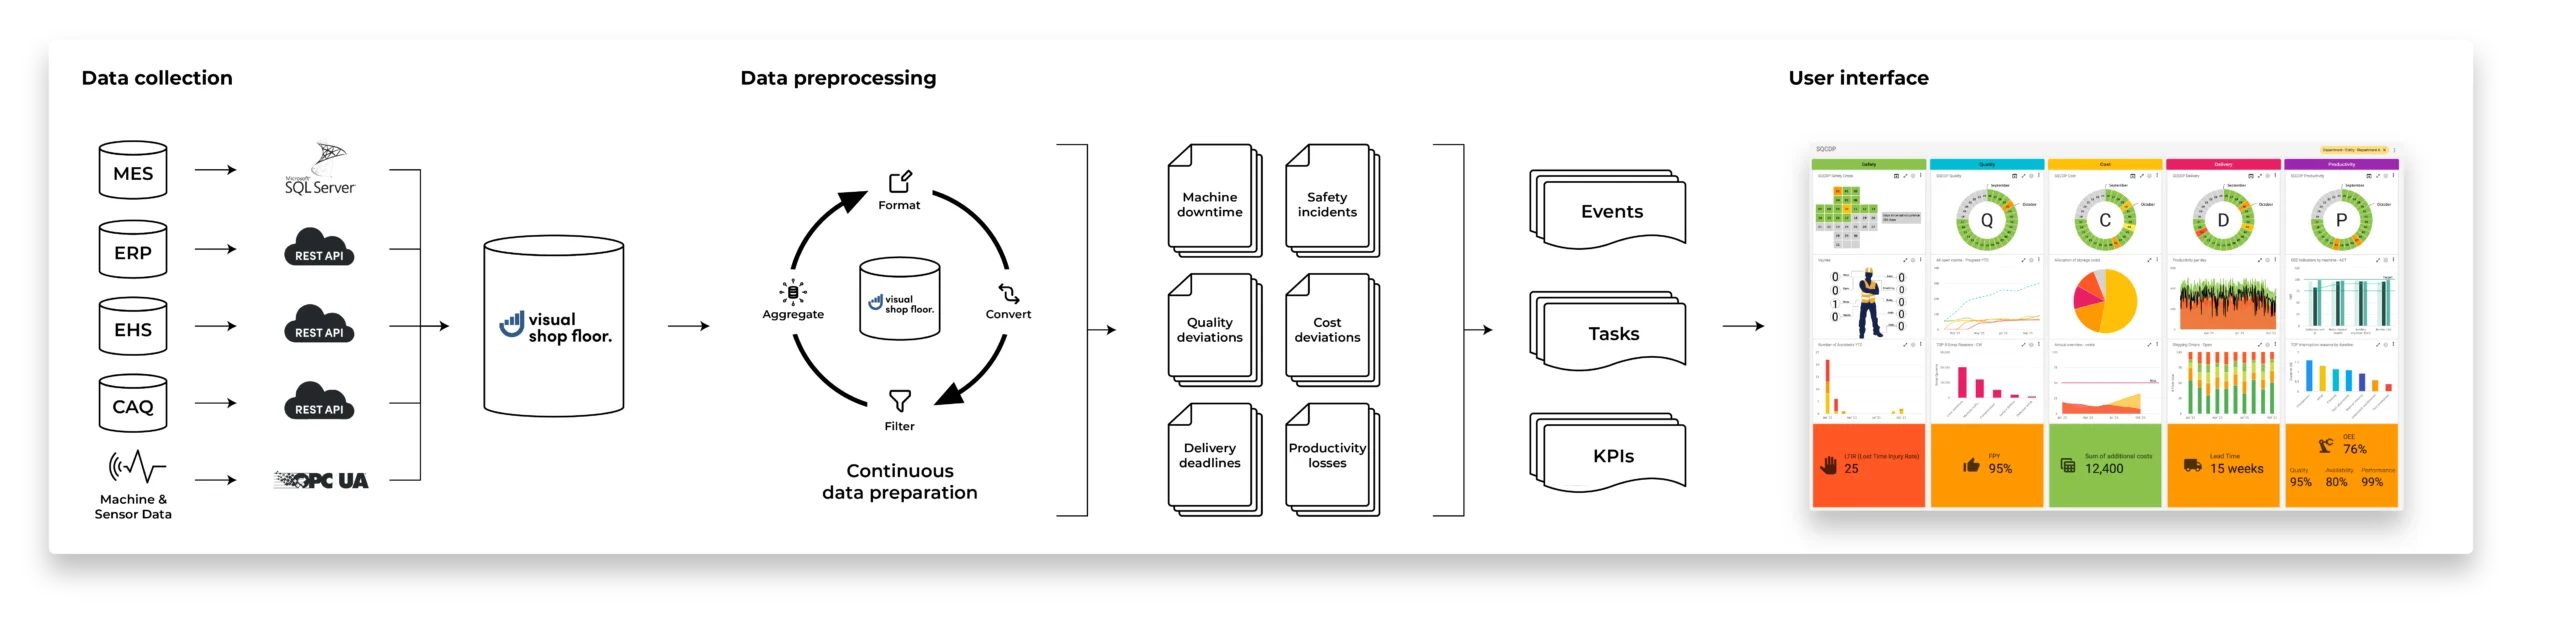
The overall structure essentially comprises the following components:
-
Integration and connection of existing systems
ERP, MES, EHS, and CAQ systems were connected via standardized interfaces. This integration forms the foundation for a consistent, complete, and up-to-date data base to represent the focus areas of Safety, Quality, Cost, Delivery, and Productivity.
-
Data preparation and consolidation
The captured data is technically cleaned, harmonized, and transformed into a unified, use-case-specific data model. This provides a reliable basis for real-time visualizations, event detection, and operational as well as strategic decision-making processes.
-
User-friendly, use-case-specific interface
Based on this data model, a structured and intuitive user interface was developed. It enables central monitoring of all SQCDP focus areas, links them with event and task management, and supports both operational and strategic decisions in shop floor management.
5. Results and benefits
Daily shop floor meetings, in particular, benefited from the clear presentation: meetings became more focused, decisions were made based on consistent data, and measures could be immediately derived and tracked.
An internal evaluation also showed a significant improvement in event capture. Incidents that were previously documented manually or in a distributed manner are now automatically recorded, standardized, and centrally displayed. This increased the completeness of event capture by approximately 60%, and critical situations can be addressed more quickly. Events from the areas of Safety, Quality, Cost, Delivery, and Productivity are now available in real time.
Key benefits at a glance:
Increased transparency and traceability
The digital SQCDP board provides all relevant information in real time. Deviations are highlighted and directly linked to causes, tasks, and responsibilities. This ensures that performance status is always clearly visible – without media breaks or information silos.
Structured and efficient meetings
With the standardized, column-based layout, all teams access the same data foundation. Discussions focus on the key points, coordination efforts are reduced, and meeting duration is noticeably shortened.
Reliable task and escalation management
Clearly defined responsibilities, deadlines, and escalation paths ensure that tasks are consistently tracked and critical issues are addressed promptly.
6. Conclusion and outlook
Visual Shop Floor provides a flexible and scalable architecture for this purpose. Additional use cases, such as digital shift logs, audit processes, problem-solving routines, or area-specific performance dashboards, can be seamlessly integrated. New data sources and visualization elements can be incorporated, allowing the system to grow with the company’s requirements without compromising overall system stability.
The deployment of the digital SQCDP board thus represents not only a technological modernization but also a significant step toward a data-driven, resilient, and learning production system.