Enhancing production efficiency through data visualization

Graphically presented data is easily understandable and provides crucial insights. Processes become easier to monitor, and trends and patterns can be identified. As a result, production becomes stable and cost-effective. What are the possibilities for data visualization and what benefits do they bring to the company?
A series of numbers in an Excel spreadsheet versus the visual representation of data in a well-structured dashboard. It's clear: For most of us, graphically presented data is easier to understand. Our brains can process images faster than a series of numbers.
Experience data visualization at a new level

Data turns into useful information

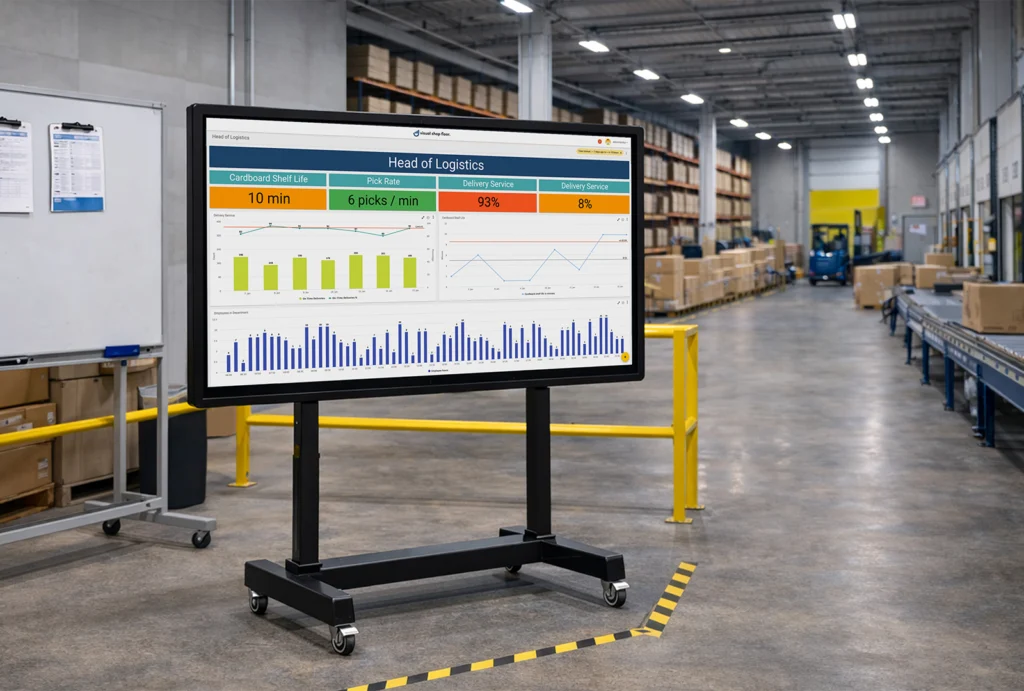
In a manufacturing company with its production lines, a vast amount of data is generated daily, constantly updating. Keeping track of all this data is almost impossible amidst this jungle of information. It is necessary to extract, collect, synthesize and correlate relevant data from various sources. By visualizing this data, numbers transform into crucial information for the company and its employees: easy to understand, communicate and apply in daily work. Clear dashboards with images, charts or other visual representations display key metrics such as target vs. actual states, patterns and trends. Even complex relationships become visible.

The viewer is crucial

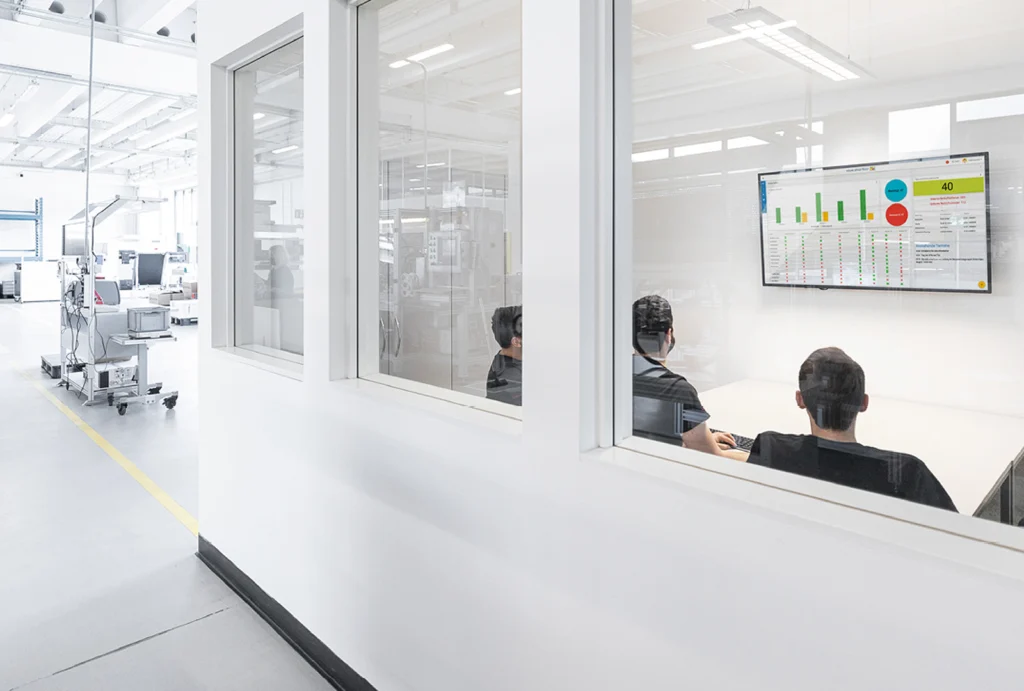
Information that is irrelevant to one's own work area can be a waste of time and energy. Therefore, selecting data based on the specific recipient is crucial: Who needs which information for their responsibilities? Should the data provide a real-time overview or delve into details? An employee monitoring machine operations on the production floor, for example, requires different information than a manager making strategic decisions. Tailoring information to fit employees' roles and needs enhances their effectiveness. Additionally, the choice of device (Info Board, PC, mobile devices) plays a crucial role in ensuring access to information from any location.

Possibilities and benefits of automatic data visualization

The software Visual Shop Floor automates data collection and visualization, whether from a single location or multiple sites. It accelerates data collection and analysis, enabling early detection of process deviations. Various visualization options are available tailored directly to the location and recipients' needs.

Role-specific Dashboards continuously display relevant and updated key metrics to employees based on their roles and functions. These dashboards include various widgets such as charts, tables, images and interactive displays. The need for coordination with colleagues decreases, enhancing collaboration. There is no unnecessary information overload, allowing activities to focus early on prioritized events in the processes.

Info Boards provide essential information directly at the point of action. Whether it's an interactive Meeting Board for discussions or a passive Andon Board on the production line or in the warehouse, employees receive real-time data that supports their activities. This includes insights into overall performance as well as the display of specific issues and bottlenecks in real time. Decision-making and discussions are based on digital facts rather than notes and assumptions.

The digital hall mirror provides a virtual representation of the facility, offering a scaled depiction of the operational environment. This enables employees to monitor production and logistics processes and resources in real-time. Early detection of deviations and disruptions allows for prompt resolution of machine issues, thereby reducing or completely preventing downtime.

Just a gimmick?

Visualized data delivers substantial benefits to the company. Processes become more stable, productivity is enhanced and resources are conserved. By highlighting trends and patterns, optimizations can be achieved. Decisions and actions are taken more swiftly. Moreover, visualization uncovers new insights hidden within the data, which are not easily detected otherwise. Therefore, data visualization can lead to surprising insights and ideas, providing the company with new competitive advantages.

Blog and product updates

Experience Visual Shop Floor live and see for yourself the wide range of possibilities.

Non-binding

Target-oriented

Individual