Table of Contents
1. Introduction
The core functional areas of Visual Shop Floor include data management, data visualization, task management and meetings, as well as the systematic implementation of continuous improvement processes. Depending on the use case, these functions are configured as needed and linked together. This results in tailor-made solutions that enable real-time process monitoring and systematic optimization.
This document is part of the series “Visual Shop Floor – Solution Blueprints.” The aim of this series is to present concrete use cases from practice in detail – both as guidance for similar projects and to illustrate the functionality and interaction of the platform’s core mechanisms. By clearly presenting the underlying principles, the blueprints also make an important contribution to training key users and administrators – thereby creating added value for decision-makers, users, and new adopters alike.
This document describes the implementation of the use case “Digital Shift Log” with the software platform Visual Shop Floor as part of a customer project. The goal was to increase transparency during shift operations through digital recording and structured preparation of relevant information, to make shift handovers as recurring processes more efficient, to reliably document and track critical events, and to systematically record and implement the resulting measures.
The present blueprint serves as a practice-oriented template for similar use cases. It helps users solve comparable challenges in a structured way, apply the functions of Visual Shop Floor in a targeted manner, and thus fully exploit the platform’s potential.
2. Background and initial situation
Daily shift handovers were also often characterized by a lack of structure and unnecessary discussions. In the absence of a consolidated overview of the events from the previous shift, department heads had to rely on verbal reports or scattered pieces of information. Tasks arising from acute or recurring problems were often not consistently documented or followed up.
Against this background, the need arose for a central, digital solution that would record shift information in a structured manner, prepare it visually, and integrate it seamlessly into subsequent processes such as task management and meetings.
The key challenges can be summarized as follows:
-
Manual and fragmented documentation:
Shift information was recorded in parallel on paper, in Excel spreadsheets, and in the production data collection system – without a centralized, unified data source.
-
Media disruptions and lack of transparency:
Unclear responsibilities and limited traceability made structured and efficient shift handovers difficult.
-
Insufficient follow-up on events and tasks:
Critical incidents and resulting actions were often not documented consistently or tracked further.
-
Lack of systematics in meetings:
The recurring shift handover meeting was not supported by a standardized, reliable process.
3. Requirements and objectives
All relevant events are captured in a central shift book and described in a structured manner. This generates information that serves both for documentation and for knowledge transfer between consecutive shifts.
In addition, the shift log facilitates efficient handovers between colleagues and prevents important information from being lost. Its primary purpose is to ensure smooth communication and the traceability of events, disruptions, and special incidents during a shift.
The digital shift log must represent essential shift-related information as automatically as possible. The foundation for this is provided by process data from machines and sensors as well as order information from the ERP system. Automated data collection and preparation increase efficiency and ensure precise documentation.
The following functional requirements were of primary importance:
-
Visualization of relevant information and key figures:
Central KPIs such as downtime, quality deviations, or event frequency must be displayed clearly and intuitively. This allows problems, bottlenecks, and trends to be identified early during the shift handover, enabling proactive management and ensuring smooth operations in the next shift.
Wichtige Informationen sind: Schichtzeiten & Personal (Wer war der Schicht zugeteilt? Gab es Abweichungen?), Maschinen- und Gerätestatus (aktueller Produktionsstatus, Störungen, Wartungstätigkeiten), Produktionsmetriken (Produktionsmengen, Ausschussraten, OEE-Werte)
-
Complete recording and documentation of shift events:
All relevant events during the shift must be recorded in full – both manually by staff and, wherever possible, automatically via interfaces (e.g., machine data, system notifications). This also includes special incidents such as safety events, quality issues, technical failures, or missing parts.
-
Standardized and user-friendly input masks:
Manual data entry must be carried out via a clearly structured, easy-to-use interface. This ensures input quality and promotes acceptance among employees in the production environment.
-
Efficient and structured shift handover:
The handover between department heads is supported by a central, chronologically ordered overview of all events. Filter functions by shift, area, or relevance enable targeted preparation and focus.
-
Integration of task management into the handover process:
Tasks already documented (e.g., in progress, completed) must be reviewed during the shift handover. New tasks – especially those directly resulting from relevant events – can be quickly and easily recorded and linked to the underlying incidents. This also includes open tasks and instructions for the upcoming shift.
-
Increases transparency in production processes
Through the structured recording and visualization of shift events, all stakeholders gain a clear overview of the production process. Problems, deviations, and disruptions are identified at an early stage and remain fully traceable at all times. In addition, specific KPIs provide the ability to detect irregularities in processes early on.
-
Improves efficiency in shift handovers
The central event overview enables focused, fact-based handovers between shifts. Relevant information is available at a glance, preventing unnecessary discussions and reducing handover times. This ensures that nothing is overlooked.
-
Provides reliable documentation
All events are recorded consistently and in a tamper-proof manner – either manually or automatically. This creates a complete information history that can also be used for evaluations, audits, or continuous improvement processes.
-
Saves time through automated data processing and analysis
Automated preparation and processing of data from machines or systems, along with the direct visualization of relevant KPIs, significantly reduce manual effort. This saves time for managers and allows them to focus on their core tasks.
4. Solution approach for the implementation with Visual Shop Floor
The solution is based on a modular, configurable design that allows flexible adaptation of the user interface to operational workflows – with a particular focus on simple and intuitive usability.
At the core of the solution is a structured event log, in which both manually recorded and automatically transmitted events are displayed. To make use of machine data and MES information in process monitoring, these systems are integrated via the existing connectors provided in Visual Shop Floor.
A dashboard specifically designed for shift handovers visualizes the event log as well as the tasks and KPIs stored in the system. As a result, all relevant information is available at a glance, and additional details can be accessed directly when needed.
For implementation, the following key building blocks of Visual Shop Floor are primarily used:
- Data collection and system integration: Connectors for linking to existing data sources.
- Data preprocessing: Modeling of data structures including data types.
- Task Management: Definition of specific task types.
- Event Handling: Definition and recording of specific events.
- User Interface: Data visualization through a dedicated dashboard as the basis for the interface, including KPIs, time series, and event frequencies.
4.1 Data Collection and System Integration
4.1.1 Data Collection and System Integration in Visual Shop Floor
Particularly strong potential emerges in the implementation of a digital shift log: here, process data from machines and sensors can be automatically captured and processed. This provides an objective representation of production processes. Important events – such as machine downtimes, order changes, or maintenance activities – are automatically recorded and documented without additional manual effort. As a result, complete traceability is ensured, and critical incidents cannot be overlooked. At the same time, automated data collection enables faster responses and more targeted problem-solving by staff, leading to more stable processes, higher efficiency, and increased productivity.
Both manual data entry and automated data streams are supported, creating a complete and objectively reliable picture of the processes. Events can be automatically detected, documented, and made available in real time for analysis or follow-up actions.
4.1.2 Data Collection and System Integration in the context „Digital Shift Log“
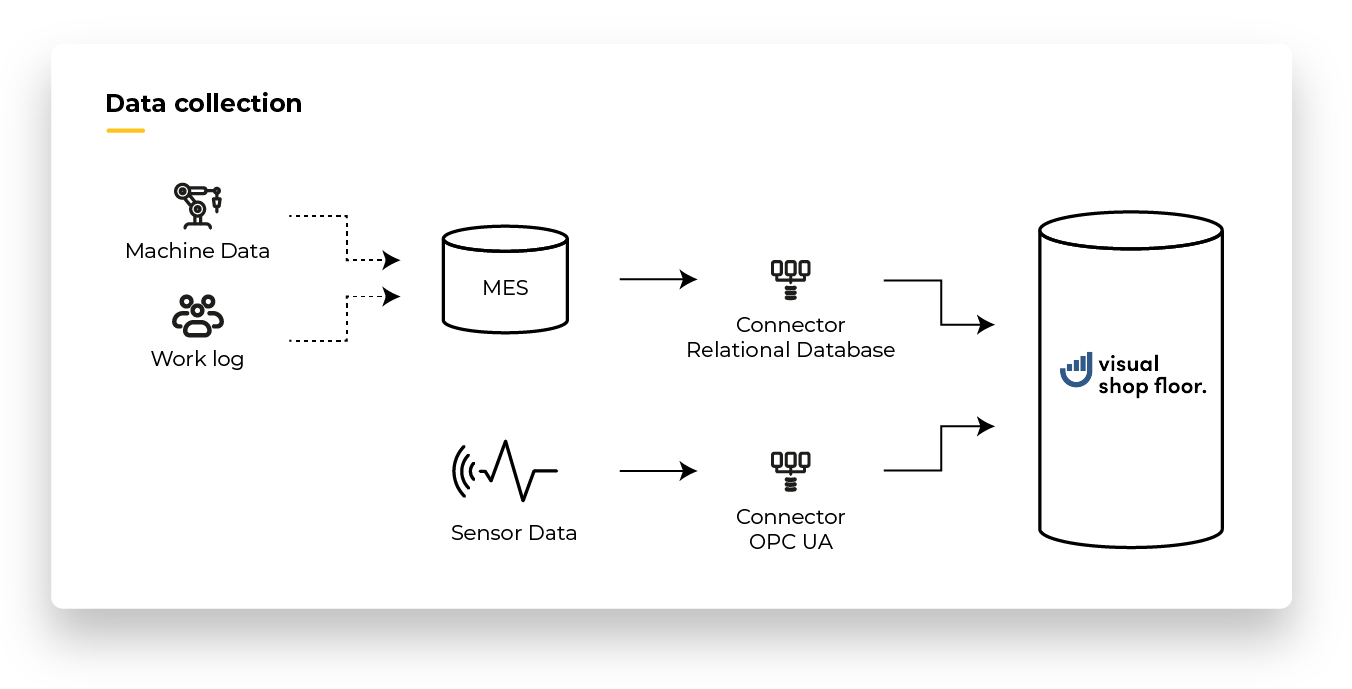
In addition to the MES system, automation and sensor data were also connected directly via the OPC UA standard. This makes it possible to capture machine downtimes, threshold violations, or status changes in real time and document them as structured events in the shift log – including timestamp, source, and affected machine.
This comprehensive integration ensures that all relevant events are automatically logged and that no information is lost during shift handovers. The result is objective transparency regarding actual process conditions, faster responses to deviations, and overall more stable operations and higher efficiency. Processes are measurably optimized, which directly translates into improved productivity and performance.
The following diagram provides a schematic representation of the process:
4.2 Data preprocessing
4.2.1 Data Preprocessing in Visual Shop Floor
A key step in this process is the conversion of raw data into defined data types, as well as the handling of outliers, faulty values, or incomplete entries. Data from heterogeneous systems is then harmonized, meaning it is correlated and aligned to enable consistent and uniform interpretation. On this basis, comprehensible KPIs can be generated – ranging from basic metrics such as downtime and frequency of malfunctions to more complex indicators such as OEE or Cpk values for in-depth analyses.
The objective is a consistent, consolidated data model that can be used for both real-time visualization and historical analyses, including deviation detection. This results in a context-based representation of production that serves as a solid foundation for well-informed decisions and continuous improvement.
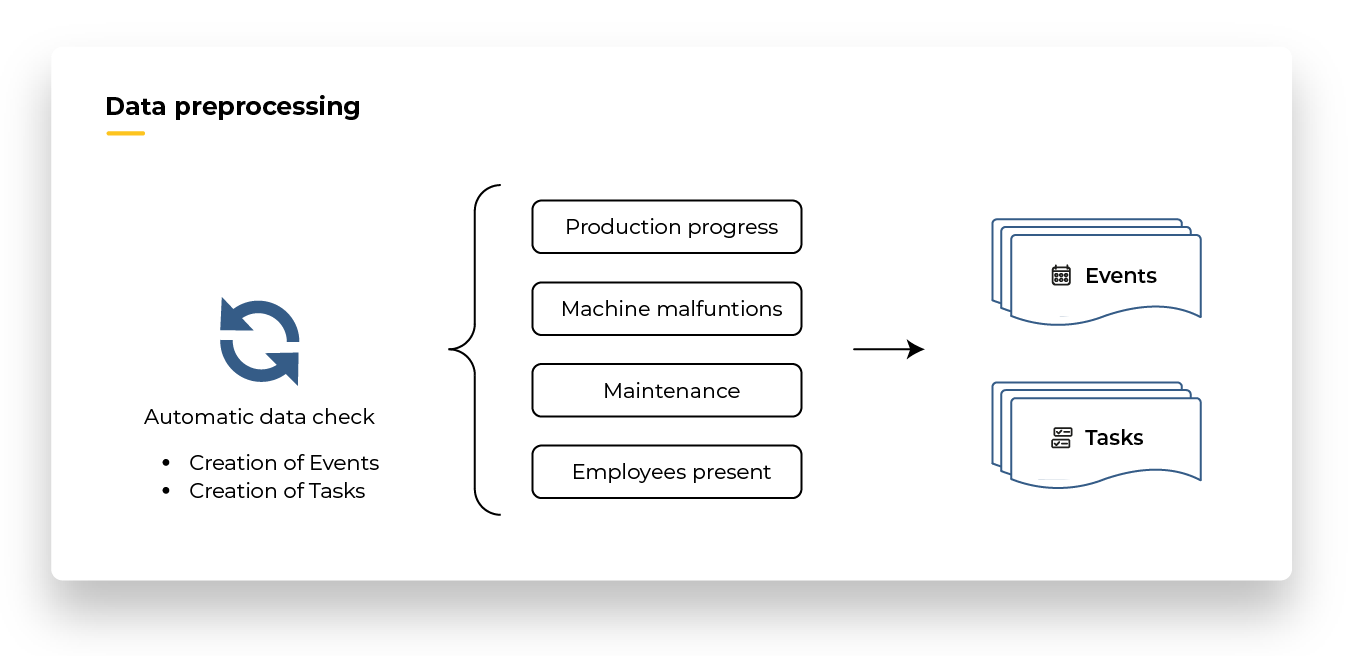
In addition, the processed data basis enables the automated detection of relevant events such as anomalies, threshold violations, or recurring fault patterns. These events are systematically recorded, classified, and provided as structured information. From them, tasks can be automatically generated in the integrated task management system, assigned to predefined user groups or individuals, and enriched with all relevant details. This ensures that the right person receives the right information at the right time and can respond appropriately.
The technical foundation for this is a rule-based action mechanism, which allows specific rules – for example, “If downtime > 10 minutes, then create an event of type ‘malfunction’ and generate a maintenance task” – to be defined, activated, or deactivated easily and without programming knowledge.
4.2.2 Data Preprocessing in the context „Digital Shift Log“
These events were displayed both in tabular form and as a visual timeline on the dashboard, providing a quick overview at the start of the shift, during the shift, and especially during handovers. In addition, further influencing factors such as ongoing maintenance activities and staff availability were integrated to better understand the context of events and to support more informed decision-making.
Through this intelligent integration of data preprocessing, event interpretation, and task management, a closed control loop was created that increased response speed, improved process stability, and digitally supported the continuous improvement process.
4.3 Task Management
4.3.1 Task Management in Visual Shop Floor
This structured approach creates full transparency, facilitates cross-shift communication, and ensures that no task is lost. In particular, through its close linkage with events, task management supports the continuous improvement of production processes, reduces response times to disruptions, and thereby contributes to greater process stability and productivity.
4.3.2 Task Management in the context „Digital Shift Log“
Direct linkage with event handling ensures that every task is anchored to its origin: the underlying issue is clearly documented and remains traceable throughout the processing cycle. This enables teams to work on eliminating the root cause rather than merely addressing symptoms.
Another advantage is cross-shift continuity: tasks created in one shift remain visible in the system and are automatically passed on to the next shift – including status and history. This ensures that no action is lost during shift handovers and that progress remains transparent at all times.
This methodology enables disruptions to be resolved early, responsibilities to be clearly defined, and tasks to be organized efficiently – regardless of the shift in which they originated. The result is more stable processes, better utilization of resources – particularly machinery – and a sustainable increase in performance as a key factor for Overall Equipment Effectiveness (OEE).
4.4 Event Handling
4.4.1 Event Handling in Visual Shop Floor
Each event is documented with relevant contextual information such as timestamp, affected equipment, process step, category, and priority. Clear categorization and prioritization make it possible to efficiently filter, assign, and forward events to the responsible individuals or teams.
A key advantage of event handling in Visual Shop Floor is its seamless integration with task management: concrete actions can be derived directly from each event, documented within the system, prioritized, and tracked through to completion. This creates a closed loop of event recording, root cause analysis, action execution, and performance monitoring – providing a solid foundation for continuous process improvement and stable production operations.
4.4.2 Event Handling in the context „Digital Shift Log“
Each event is centrally stored in the system and automatically logged in the chronological event list for the shift. This ensures that all stakeholders – from shift personnel to production management – have access to the current status and the historical progression at any time.
At shift handover, this provides a complete and transparent event history. Through direct integration with task management, follow-up tasks can be generated immediately from each event and automatically assigned to the responsible employees or teams – even across shifts. This makes it clear at all times who is responsible, what needs to be done, and by when it must be completed.
This structured process ensures that no disruption is overlooked or incompletely documented. Events remain traceable from initial recording through to final resolution, supporting sustainable root cause elimination. As a result, communication between shifts improves, response times are shortened, and processes become more stable. At the same time, downtime is reduced, while performance – as a key factor for Overall Equipment Effectiveness (OEE) – is measurably increased.
4.5 User Interface
4.5.1 Design of User Interfaces in Visual Shop Floor
A wide range of components is available for design: interactive charts, KPI and metric widgets for data visualization, widgets for displaying events and tasks, as well as elements for showing PDF documents, images, or videos. In addition, input widgets can be integrated to allow users to directly capture data in a simple and intuitive way. This makes it possible to consolidate production KPIs, process information, current events, and open tasks into a single, consistent interface – visually appealing and functionally geared toward fast information intake and immediate action.
The dashboards are scalable across different devices and usage scenarios: from large-format shop floor boards in production areas to stationary workstations, tablets, or mobile devices. Layout adjustments, changes to data sources, or the addition of new widgets can be implemented easily without programming knowledge, thanks to the no-code/low-code approach.
This flexibility allows user interfaces to be adapted at any time to new requirements, changed processes, or additional information needs. It increases user acceptance, improves the availability of decision-relevant information, and ensures that KPIs, events, and actions are always presented in real time and in the right context – a key foundation for quick decisions and smooth workflows in production processes as well as in shop floor management.
4.5.2 Design of User Interfaces in the context „Digital Shift Log“
Integrated event and task lists immediately highlight open incidents and actions, document their processing, and ensure smooth handover across shifts. In addition, KPIs such as OEE and failure frequency provide a transparent overview of the current production status and make the need for action visible at a glance.
The flexible arrangement and combination of widgets enable a tailored presentation aligned with the flow of the shift handover. Chronologically sorted events, current task status, and key performance indicators are presented in a consistent, clearly structured layout. Context filters allow teams to display only the data relevant to them or the ongoing shift, increasing information density and minimizing distractions.
The result is optimized information flows, shorter response times to disruptions, and greater process stability. The visual consolidation of all relevant content in one place reduces search times, increases transparency, and fosters proactive action – both within a single shift and across multiple shifts.
4.5.2.1 Dashboard structure and description of the components used
-
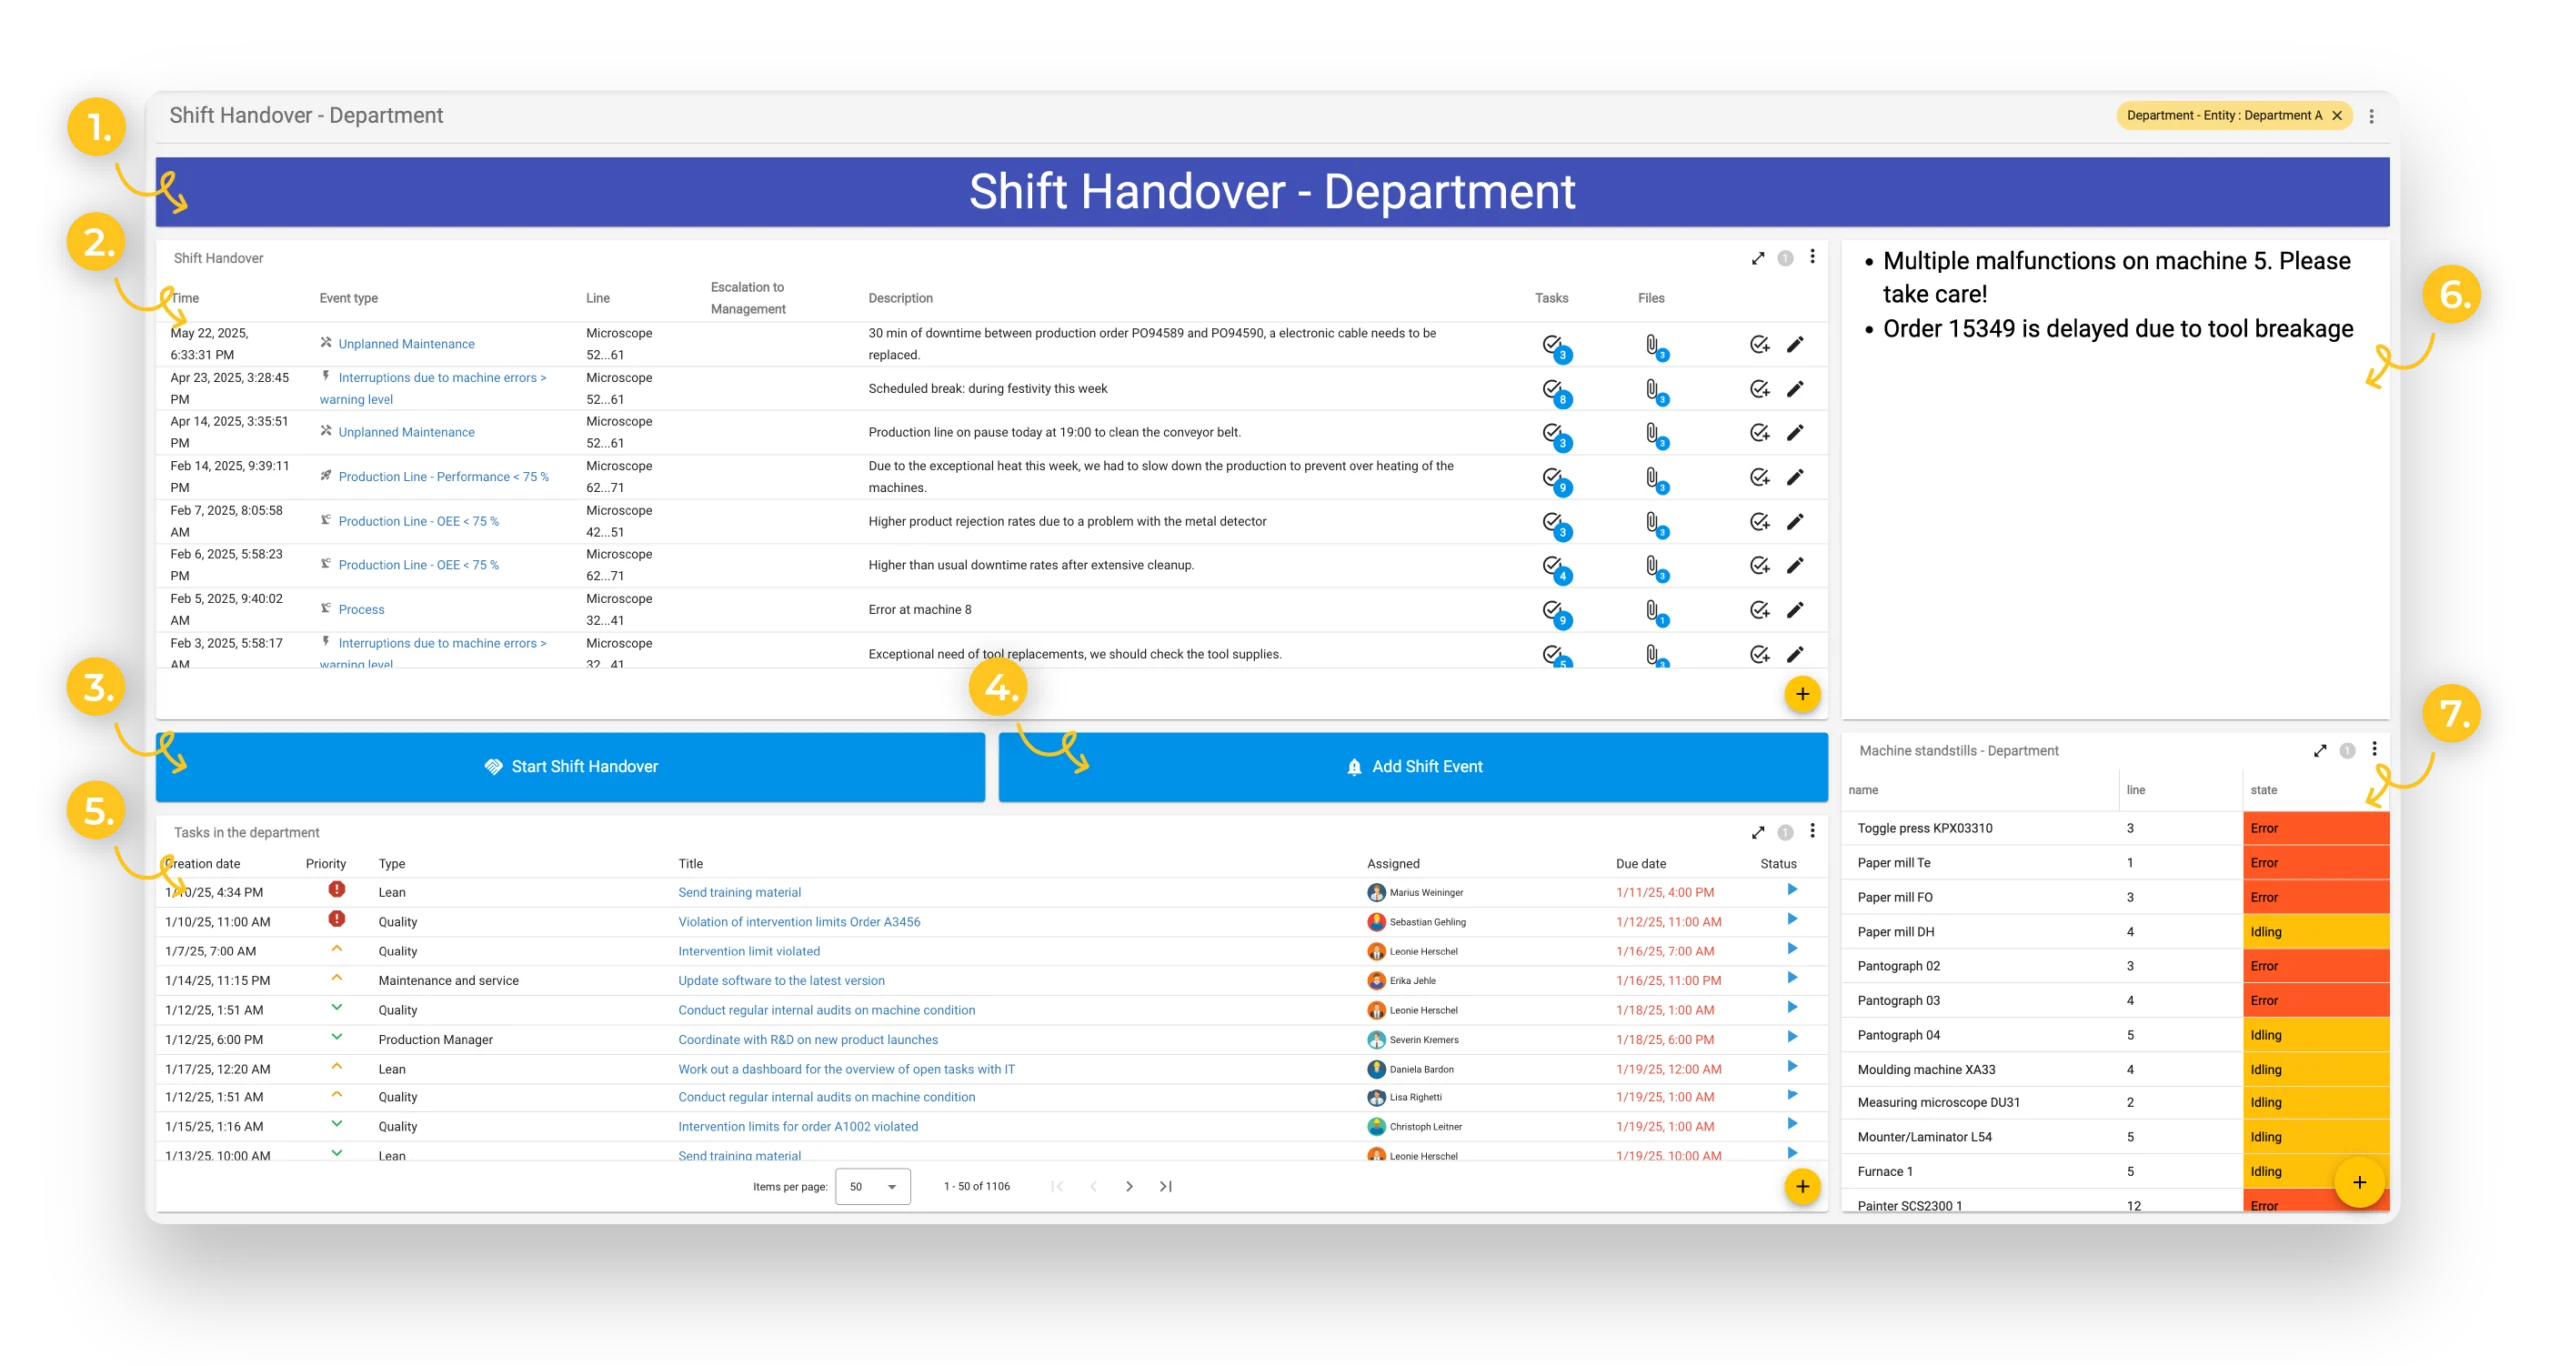
Title section with department display
The title of the dashboard is shown at the top, supplemented with information about the department in which the shift handover is being conducted. This makes it immediately clear which production or organizational area the displayed content refers to. It simplifies orientation, especially in large plants or in environments with multiple teams working in parallel.
-
Table with event overview
A central table lists all events that occurred during the shift, whether captured automatically (e.g., via machine signals or sensor data) or entered manually. Each event includes key information such as timestamp, affected machine/equipment, event type, and a brief description.
Function buttons are available directly within the table, allowing tasks to be created immediately for an event or supporting documents (e.g., photos, PDF reports, inspection results) to be uploaded. This ensures that event documentation can be completed quickly and comprehensively without leaving the view.
-
Button to start a shift handover
With the clearly visible “Start Shift Handover” button, handovers between two shifts can be documented directly and in a structured way. All relevant information is captured, open tasks are transparently transferred, and the flow of information is ensured without gaps. This guarantees a smooth handover and secures continuity in production operations.
-
Button for manually adding events
A clearly visible “Add Event” button allows new incidents to be recorded – either during the shift or directly at the time of handover. This makes it possible to document events retrospectively that had not yet been entered into the system, ensuring a complete event history.
-
Table with task overview
A second table displays all current tasks, either still in progress or recently completed. For each task, key details are shown, including the responsible person, current processing status, priority, and due date. This structured presentation ensures that open items are clearly visible, responsibilities remain transparent, and urgent tasks can be prioritized and addressed accordingly.
-
Text widget for important announcements
The text widget can be used to prominently display key announcements for the team. Content can be entered manually, allowing important information to be provided quickly and in a targeted manner at any time.
-
Data visualization of machine downtimes
The data visualization widget makes it possible to clearly present KPIs and information relevant to shift handovers. A table displays the current machine status of each line, with machines requiring immediate attention highlighted. This ensures the team maintains an overview and can address issues efficiently and in a targeted manner.
4.5.2.2 Recording a Shift Handover
The process is initiated via a clearly visible and easy-to-use button. Clicking it opens a dialog for recording the details of the shift handover.

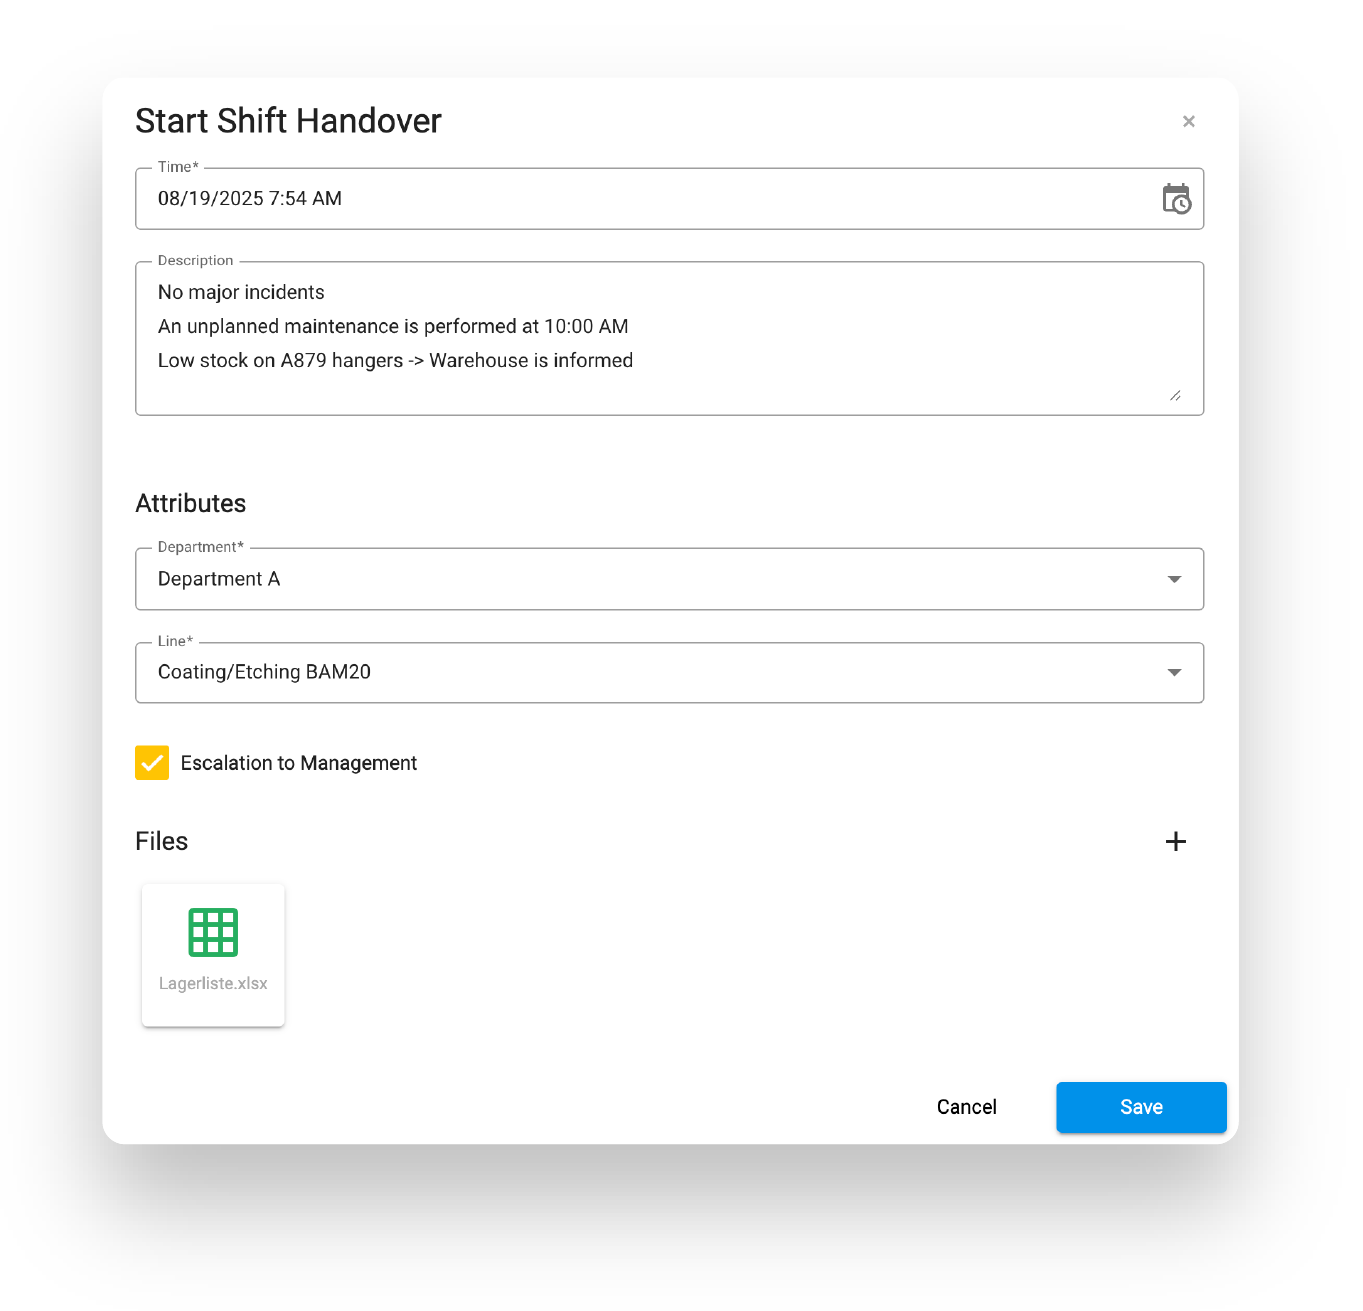
For special situations, predefined workflows can be triggered to escalate specific events directly to management or other relevant stakeholders. This ensures not only thorough documentation of the handover but also a timely response to critical issues.
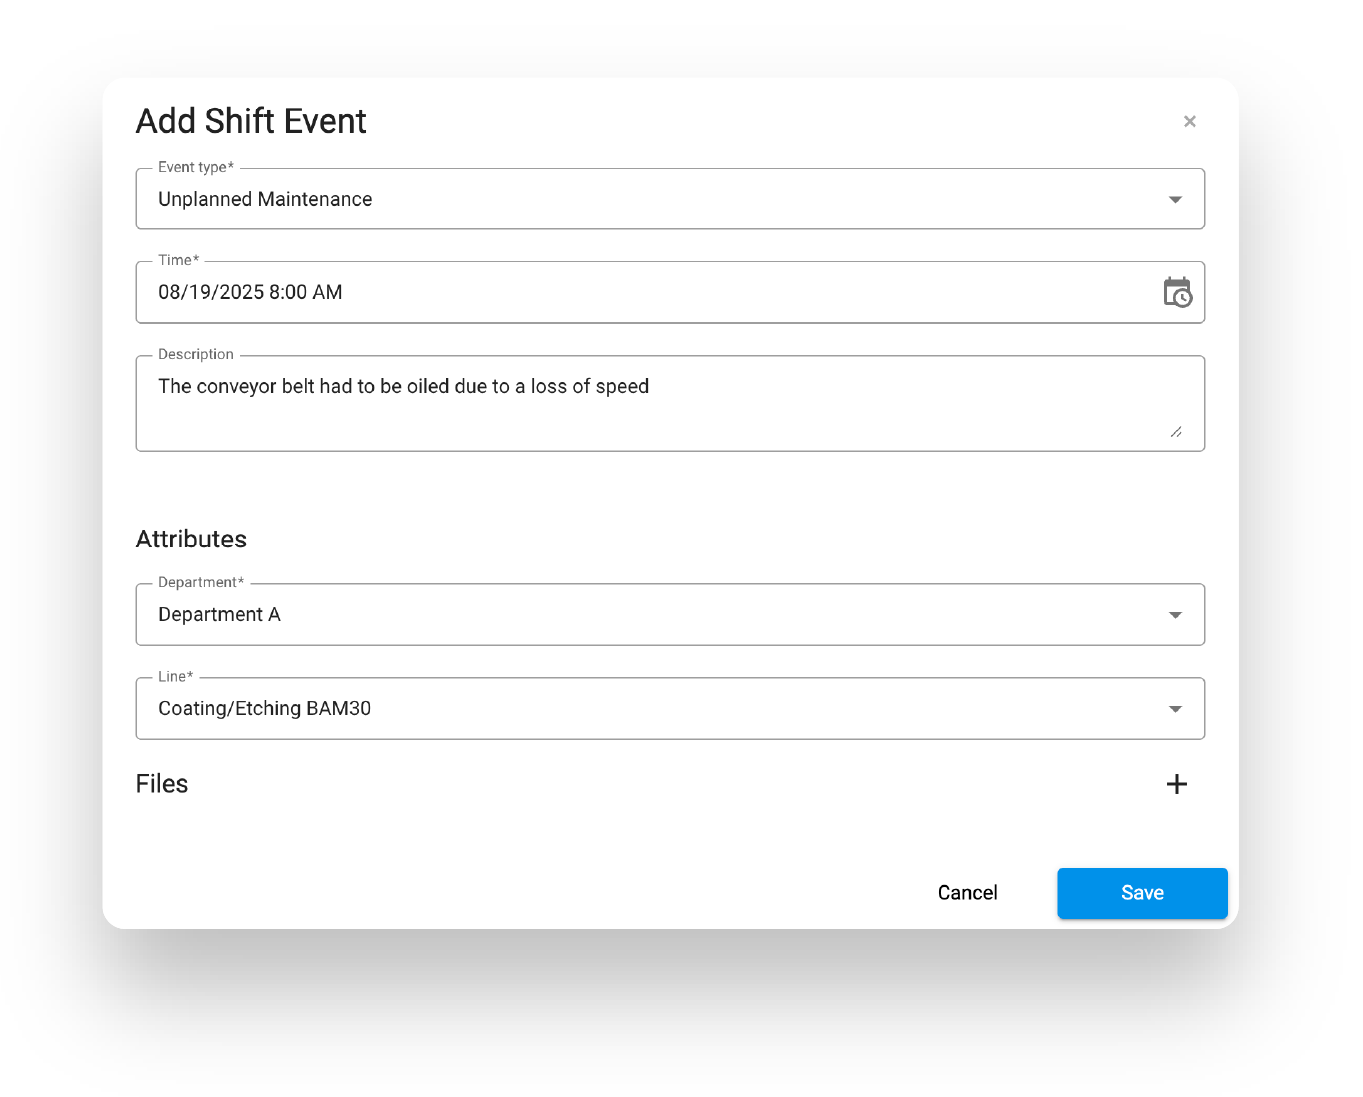
4.5.2.3 Recording a new shift event
If a relevant event occurs that is important for the next shift or for management, it can be logged with a single click on the corresponding button. A dialog then opens, similar to the form used for shift handovers.
In this dialog, employees can:
- provide a meaningful description of the situation to capture all relevant details
- attach supporting files such as photos, inspection reports, or other documents to add context
- enter specific information in the description field that is crucial for the later processing or follow-up of tasks resulting from the event

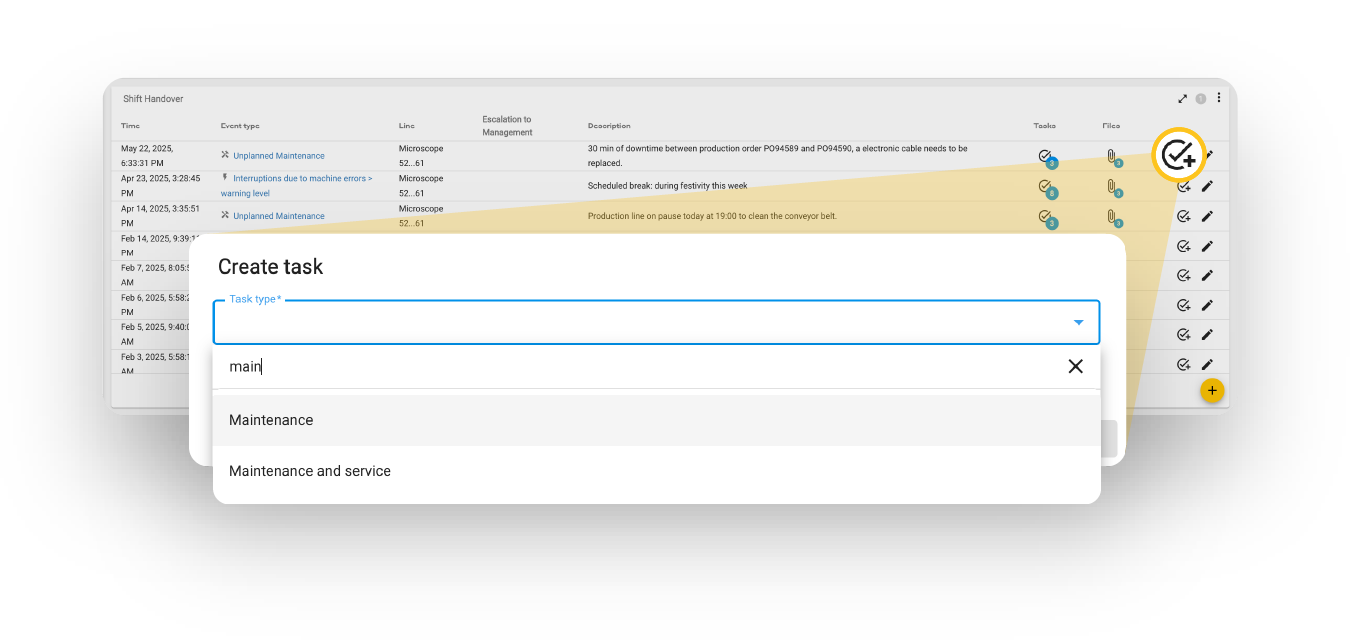
4.5.2.4 Add and view tasks for events
For each event, a symbol is displayed in the “Tasks” column. The number shown on the symbol indicates how many tasks are linked to that event. Clicking the symbol opens a dialog listing all associated tasks along with their detailed information.
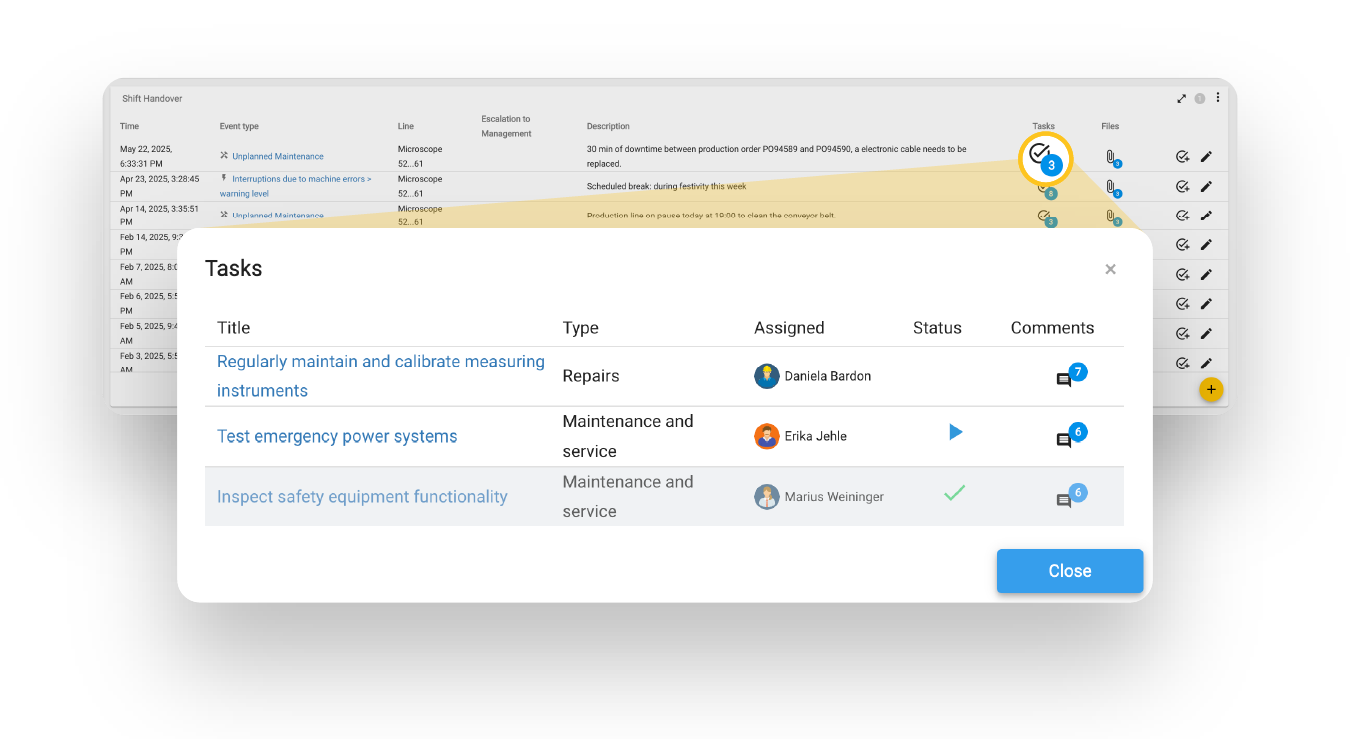
Using the “Create Task” button, new tasks can be created and immediately assigned to an event. The person to whom the task is assigned automatically receives an email notification, ensuring that processing begins promptly.
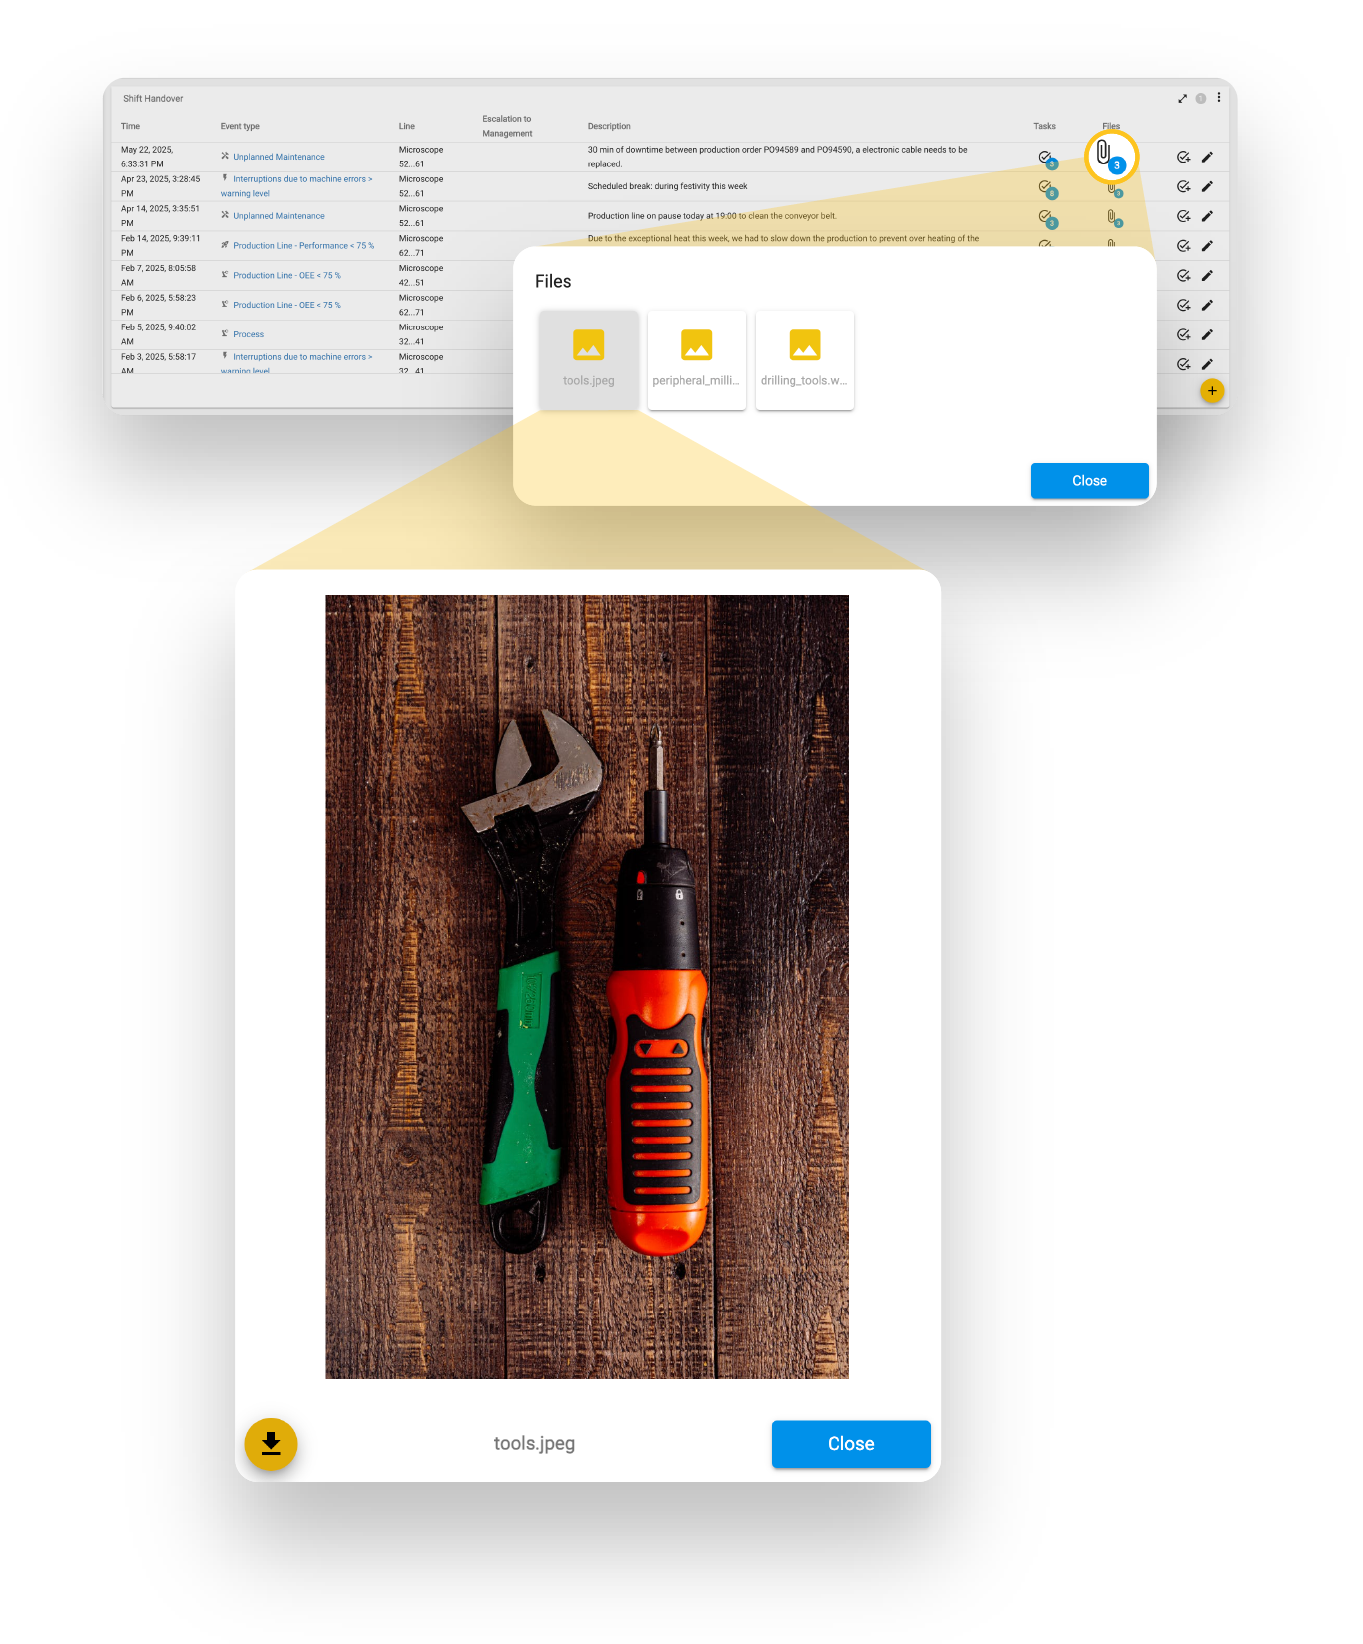
4.5.2.5 File attachments for events
Files linked to an event can be easily and directly accessed by clicking the file icon in the corresponding table row of the event. A dialog then opens, displaying a clear list of all associated files.
Depending on the file format, a preview is also shown, allowing content to be quickly reviewed without the need for a separate download. If necessary, files can also be downloaded or deleted from this view to keep the data set current and relevant.
This feature not only supports complete and structured event documentation but also ensures that all stakeholders have access to up-to-date, context-specific information at any time – regardless of shift or department.
4.6 System overview – structure and interaction of components
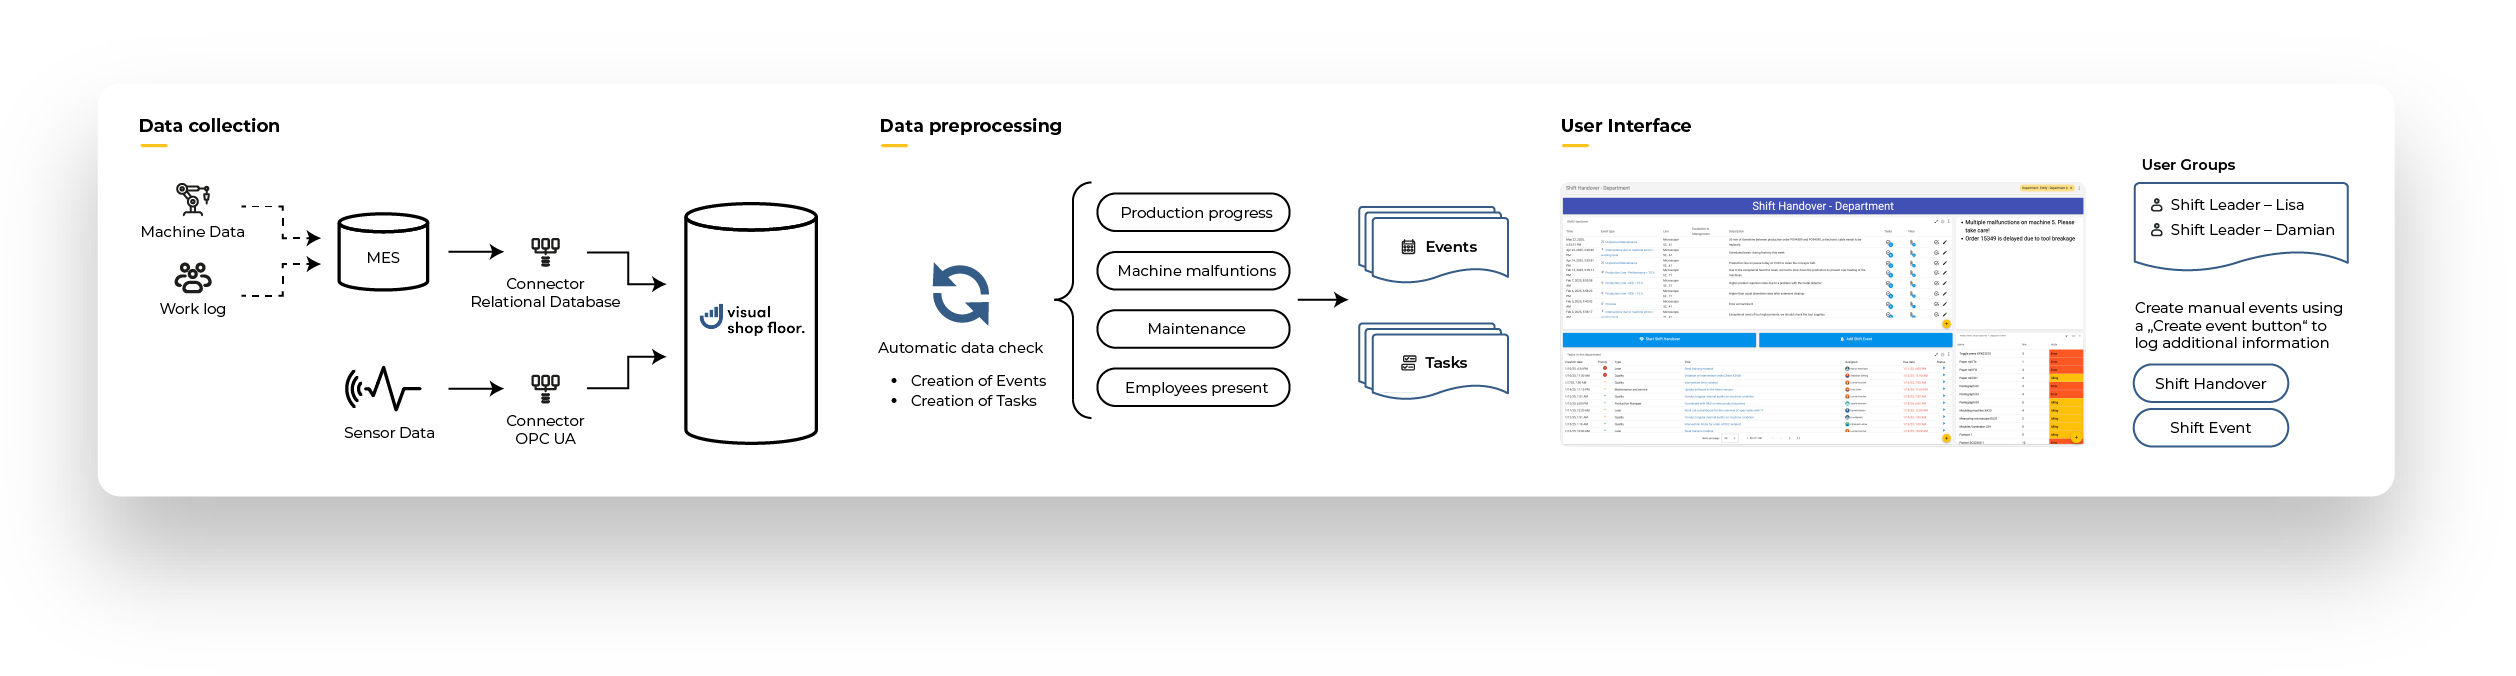
The representation is based on a real-world use case and, as is often the case in practice, covers the following areas:
-
Integration and connection of existing systems
In the example, an existing MES system as well as sensor technology were integrated. This automated data collection was supplemented by the manual entry of relevant information by employees directly within the user interface.
-
Data preparation and consolidation
The collected data was technically processed, consolidated, and transferred into a standardized data model optimized for the use case. This provides a consistent and reliable data basis for analyses, visualizations, and decision-making processes.
-
Creation of a user-friendly interface
Based on the processed data, an easy-to-use, intuitive user interface was designed, giving users efficient and purposeful access to all relevant information – aligned with the workflows of the shift handover.
The implementation in Visual Shop Floor offers a range of practical advantages:
- Rapid implementation through the no-code approach
- High adaptability to different areas, shift models, or locations
- Reduced training effort thanks to intuitive operation
- Seamless integration of documentation, analysis, and action tracking
- High transparency and audit security of the entire shift documentation
5. Results and benefits
The following key benefits were identified:
Improved transparency and traceability
Through the structured recording of all shift events – both automated and manual – there is now a complete, audit-proof documentation of the shift process. All stakeholders have access at any time to both current and historical events as well as related actions. This facilitates shift handovers, improves internal communication, and creates a fact-based foundation for decision-making.
More efficient shift handovers
Handovers that were previously time-consuming and sometimes incomplete have been replaced by a clearly structured overview. Department managers can focus specifically on critical points without relying on verbal reports or scattered pieces of information. This saves time, reduces misunderstandings, and increases the reliability of information.
Systematic task tracking
The direct linkage between events and tasks enables consistent follow-up. Responsibilities, deadlines, and statuses are clearly visible, while inquiries and escalations take place in a structured and documented manner – a key foundation for continuous improvement processes.
Early detection of patterns
Dashboards visualize recurring disruptions, bottlenecks, or anomalies and make them quickly identifiable. This supports root cause analysis (e.g., in the continuous improvement process) and enables sustainable process optimizations.