

PDCA cycle: Why companies should opt for a digital solution
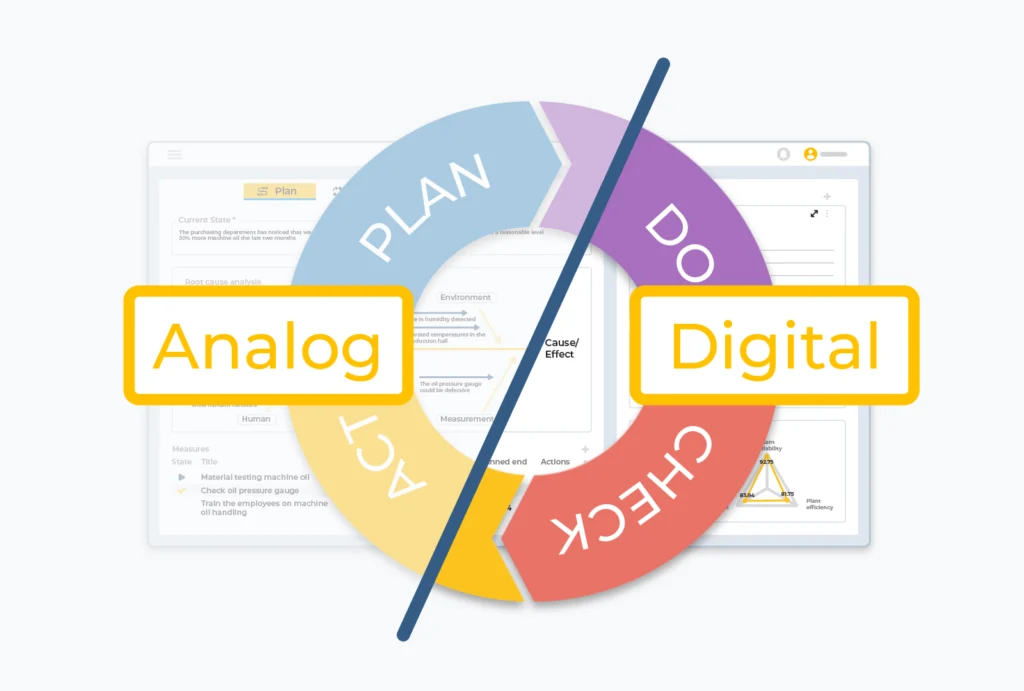
A structured approach to continuous improvement is essential for efficiency in production and logistics processes. The PDCA cycle (Plan-Do-Check-Act) has established itself as an indispensable methodology in Lean Management. However, while many companies still conduct the PDCA cycle in an analog manner with paper and pen, digitalization offers significant advantages. So why should companies handle their PDCA cycles digitally?